Insights, costs and exposure
Insights answers what could be better. It lists observations about your portfolio, each with the assumption behind it, and four detail pages: Tax and domicile, Costs, Exposure and Independence.
Observations
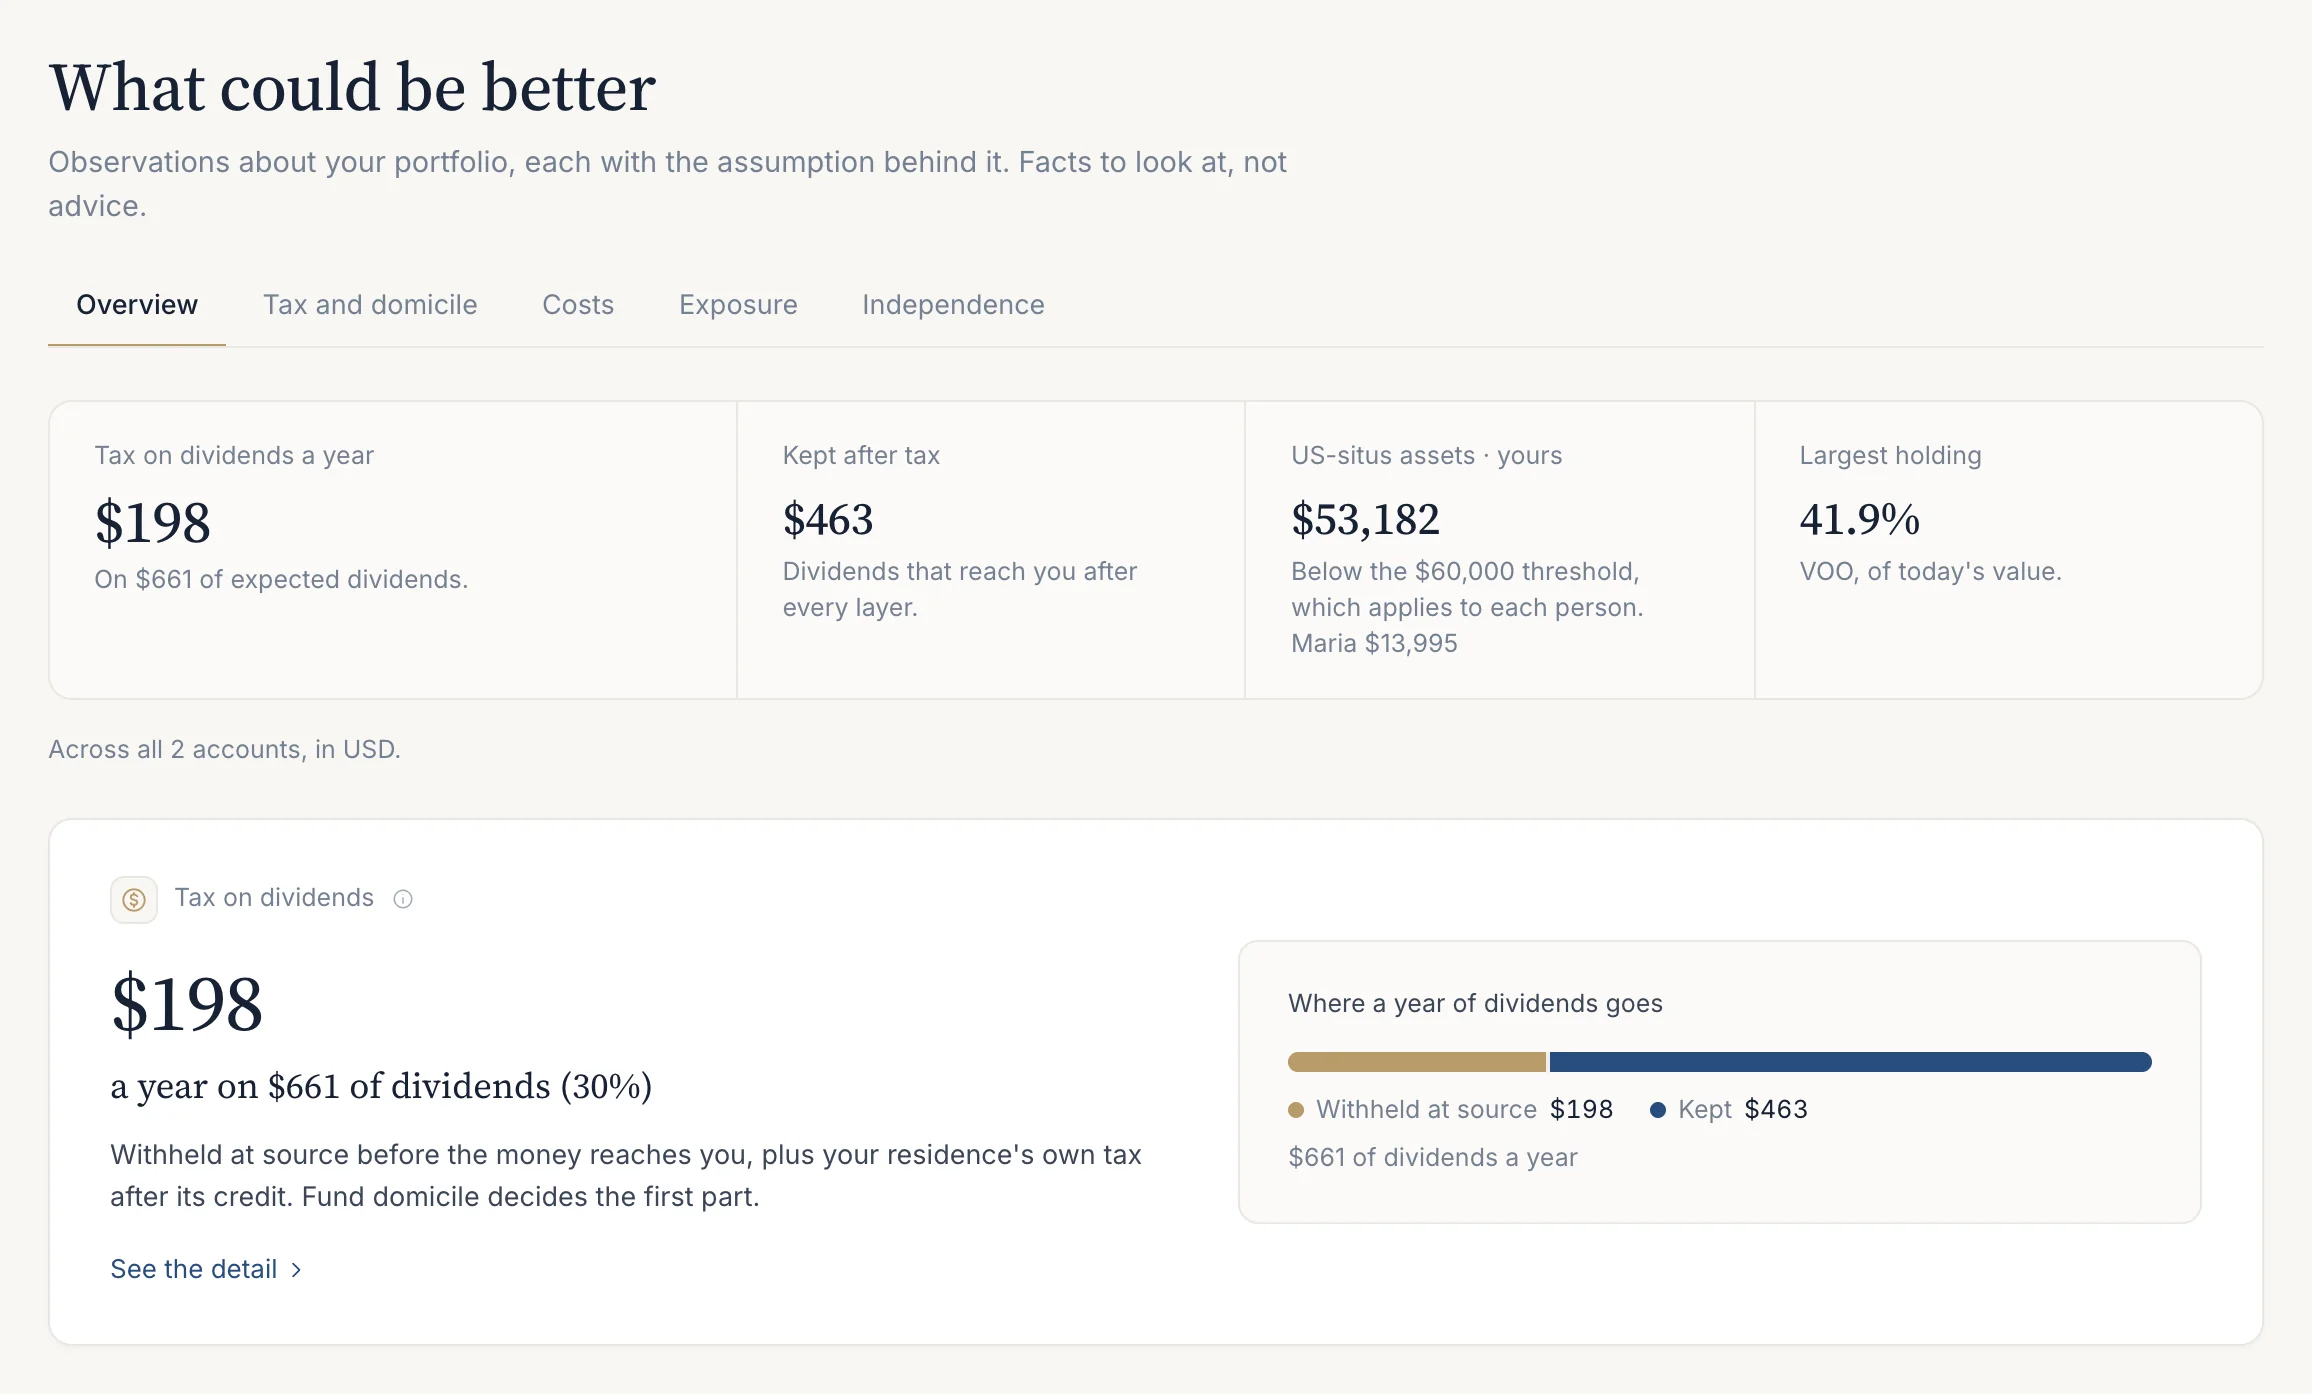
Insights (/insights) ranks observations by how much each one changes what you keep or what is at stake: dividend tax, fund domicile, costs, concentration and currency. Each says what it is based on. They are facts to look at, not advice. When nothing stands out, the page says so and links to the detail pages.
On Free you see every observation’s headline and the first one in detail; Pro opens every one. Figures come from your imported holdings and the tax residence in Settings.
Tax and domicile
Dividend tax at source and at home, US funds against their Irish counterparts, European withholding with claim deadlines, US estate exposure and residence scenarios. See Tax and domicile.
Costs
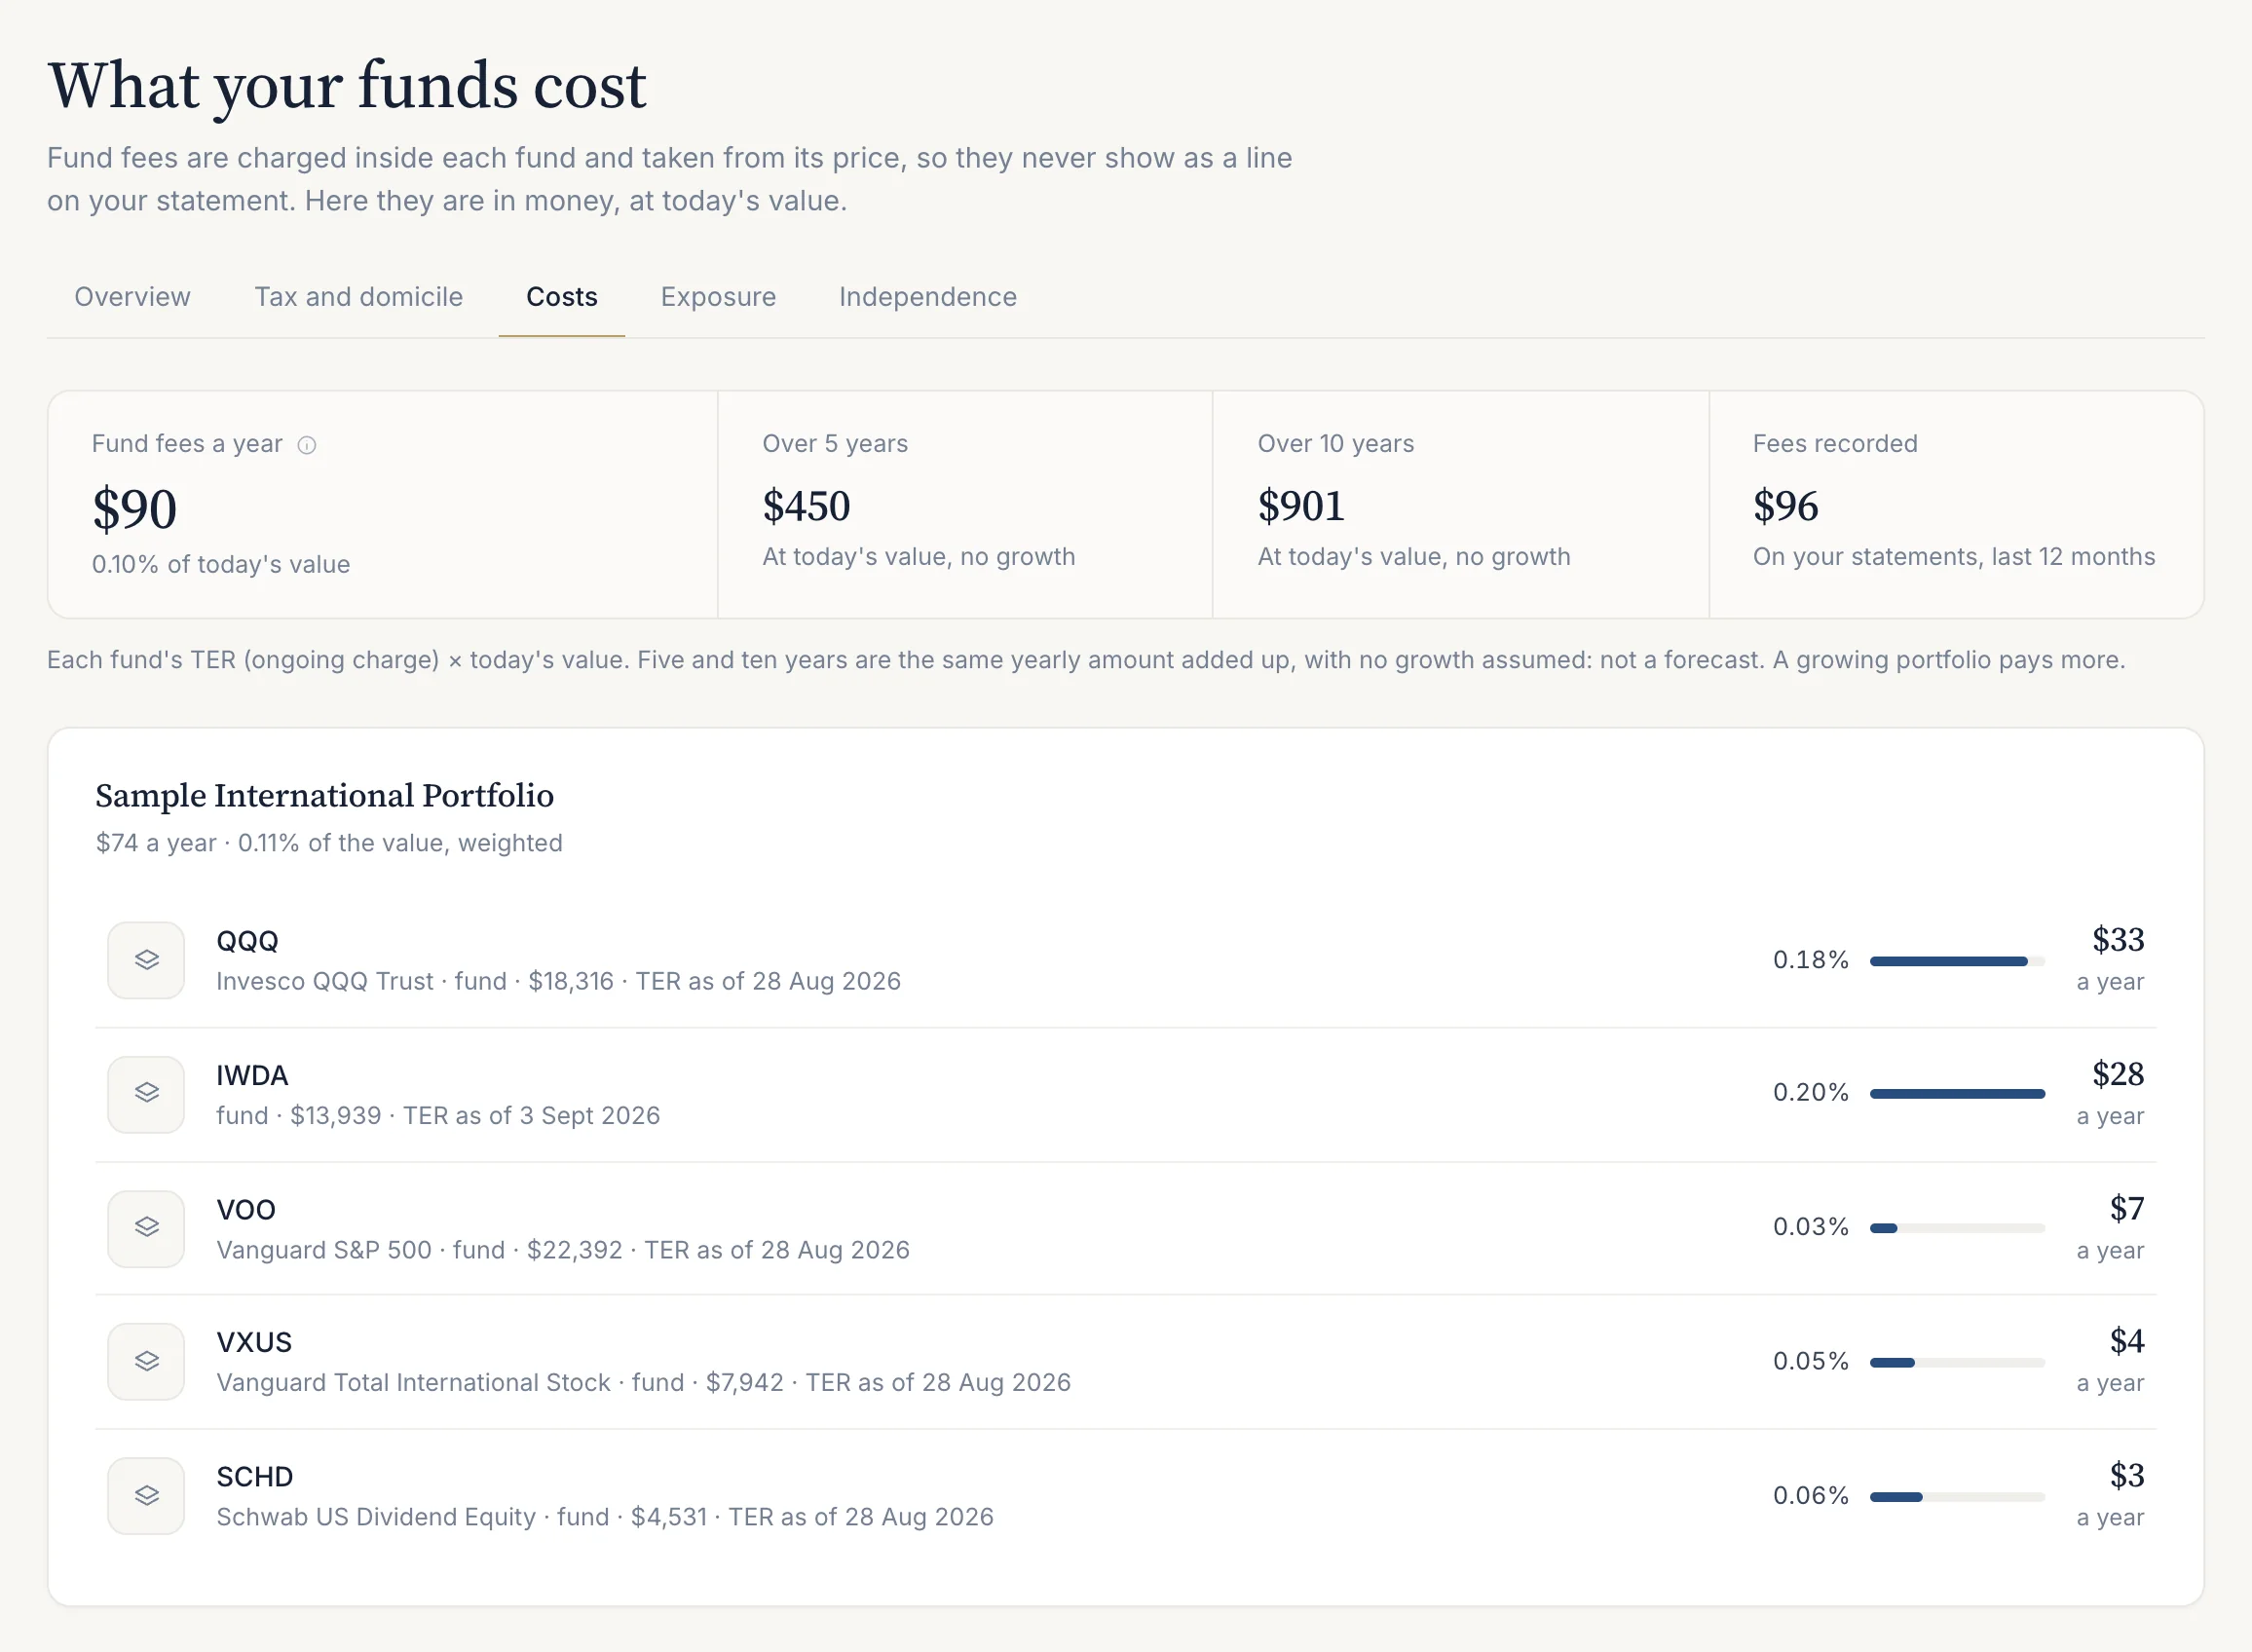
Costs (/insights/costs) shows what your funds cost in money: fund fees a year, over 5 years and over 10 years, and the fees your broker recorded. Each fund’s fee is its ongoing charge (TER) multiplied by today’s value; five and ten years are the same yearly amount added up, with no growth assumed, so they are not a forecast. Shares have no fund fee. Below, each holding’s charge and yearly cost are listed (Pro), followed by commissions and account fees from your statements over the last 12 months. Transaction spreads, currency conversion and platform fees outside your statements are not included.
Exposure
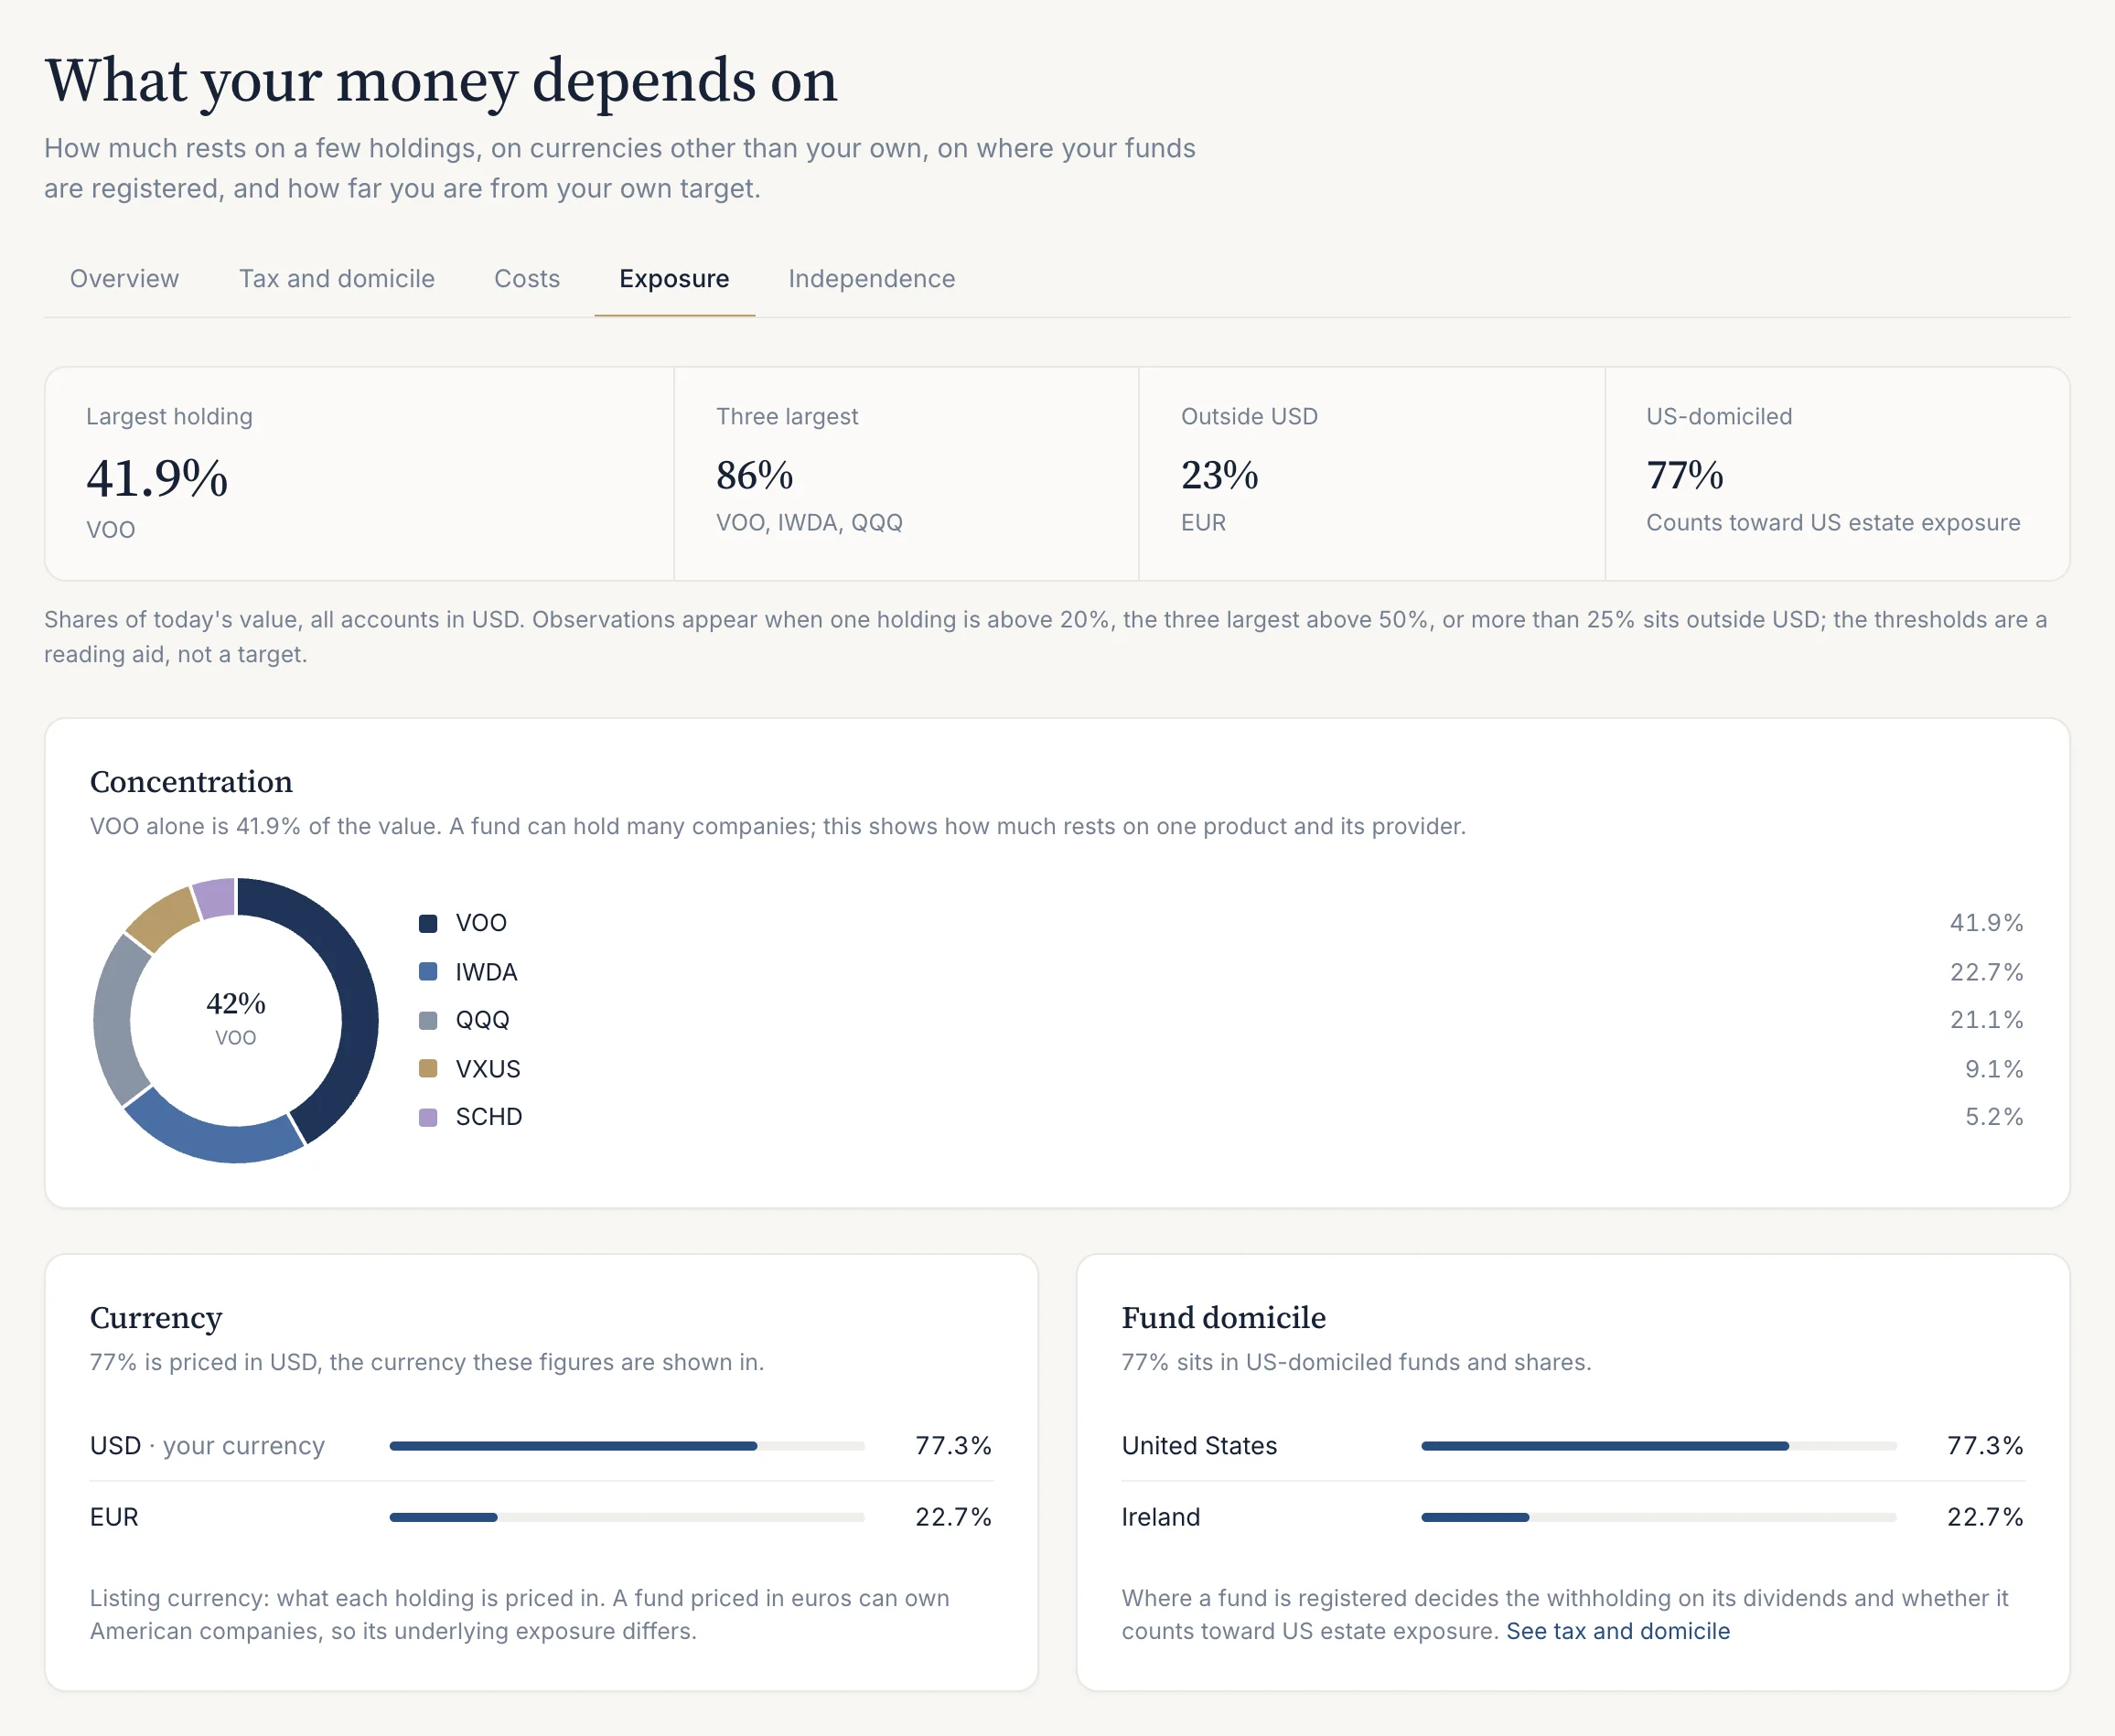
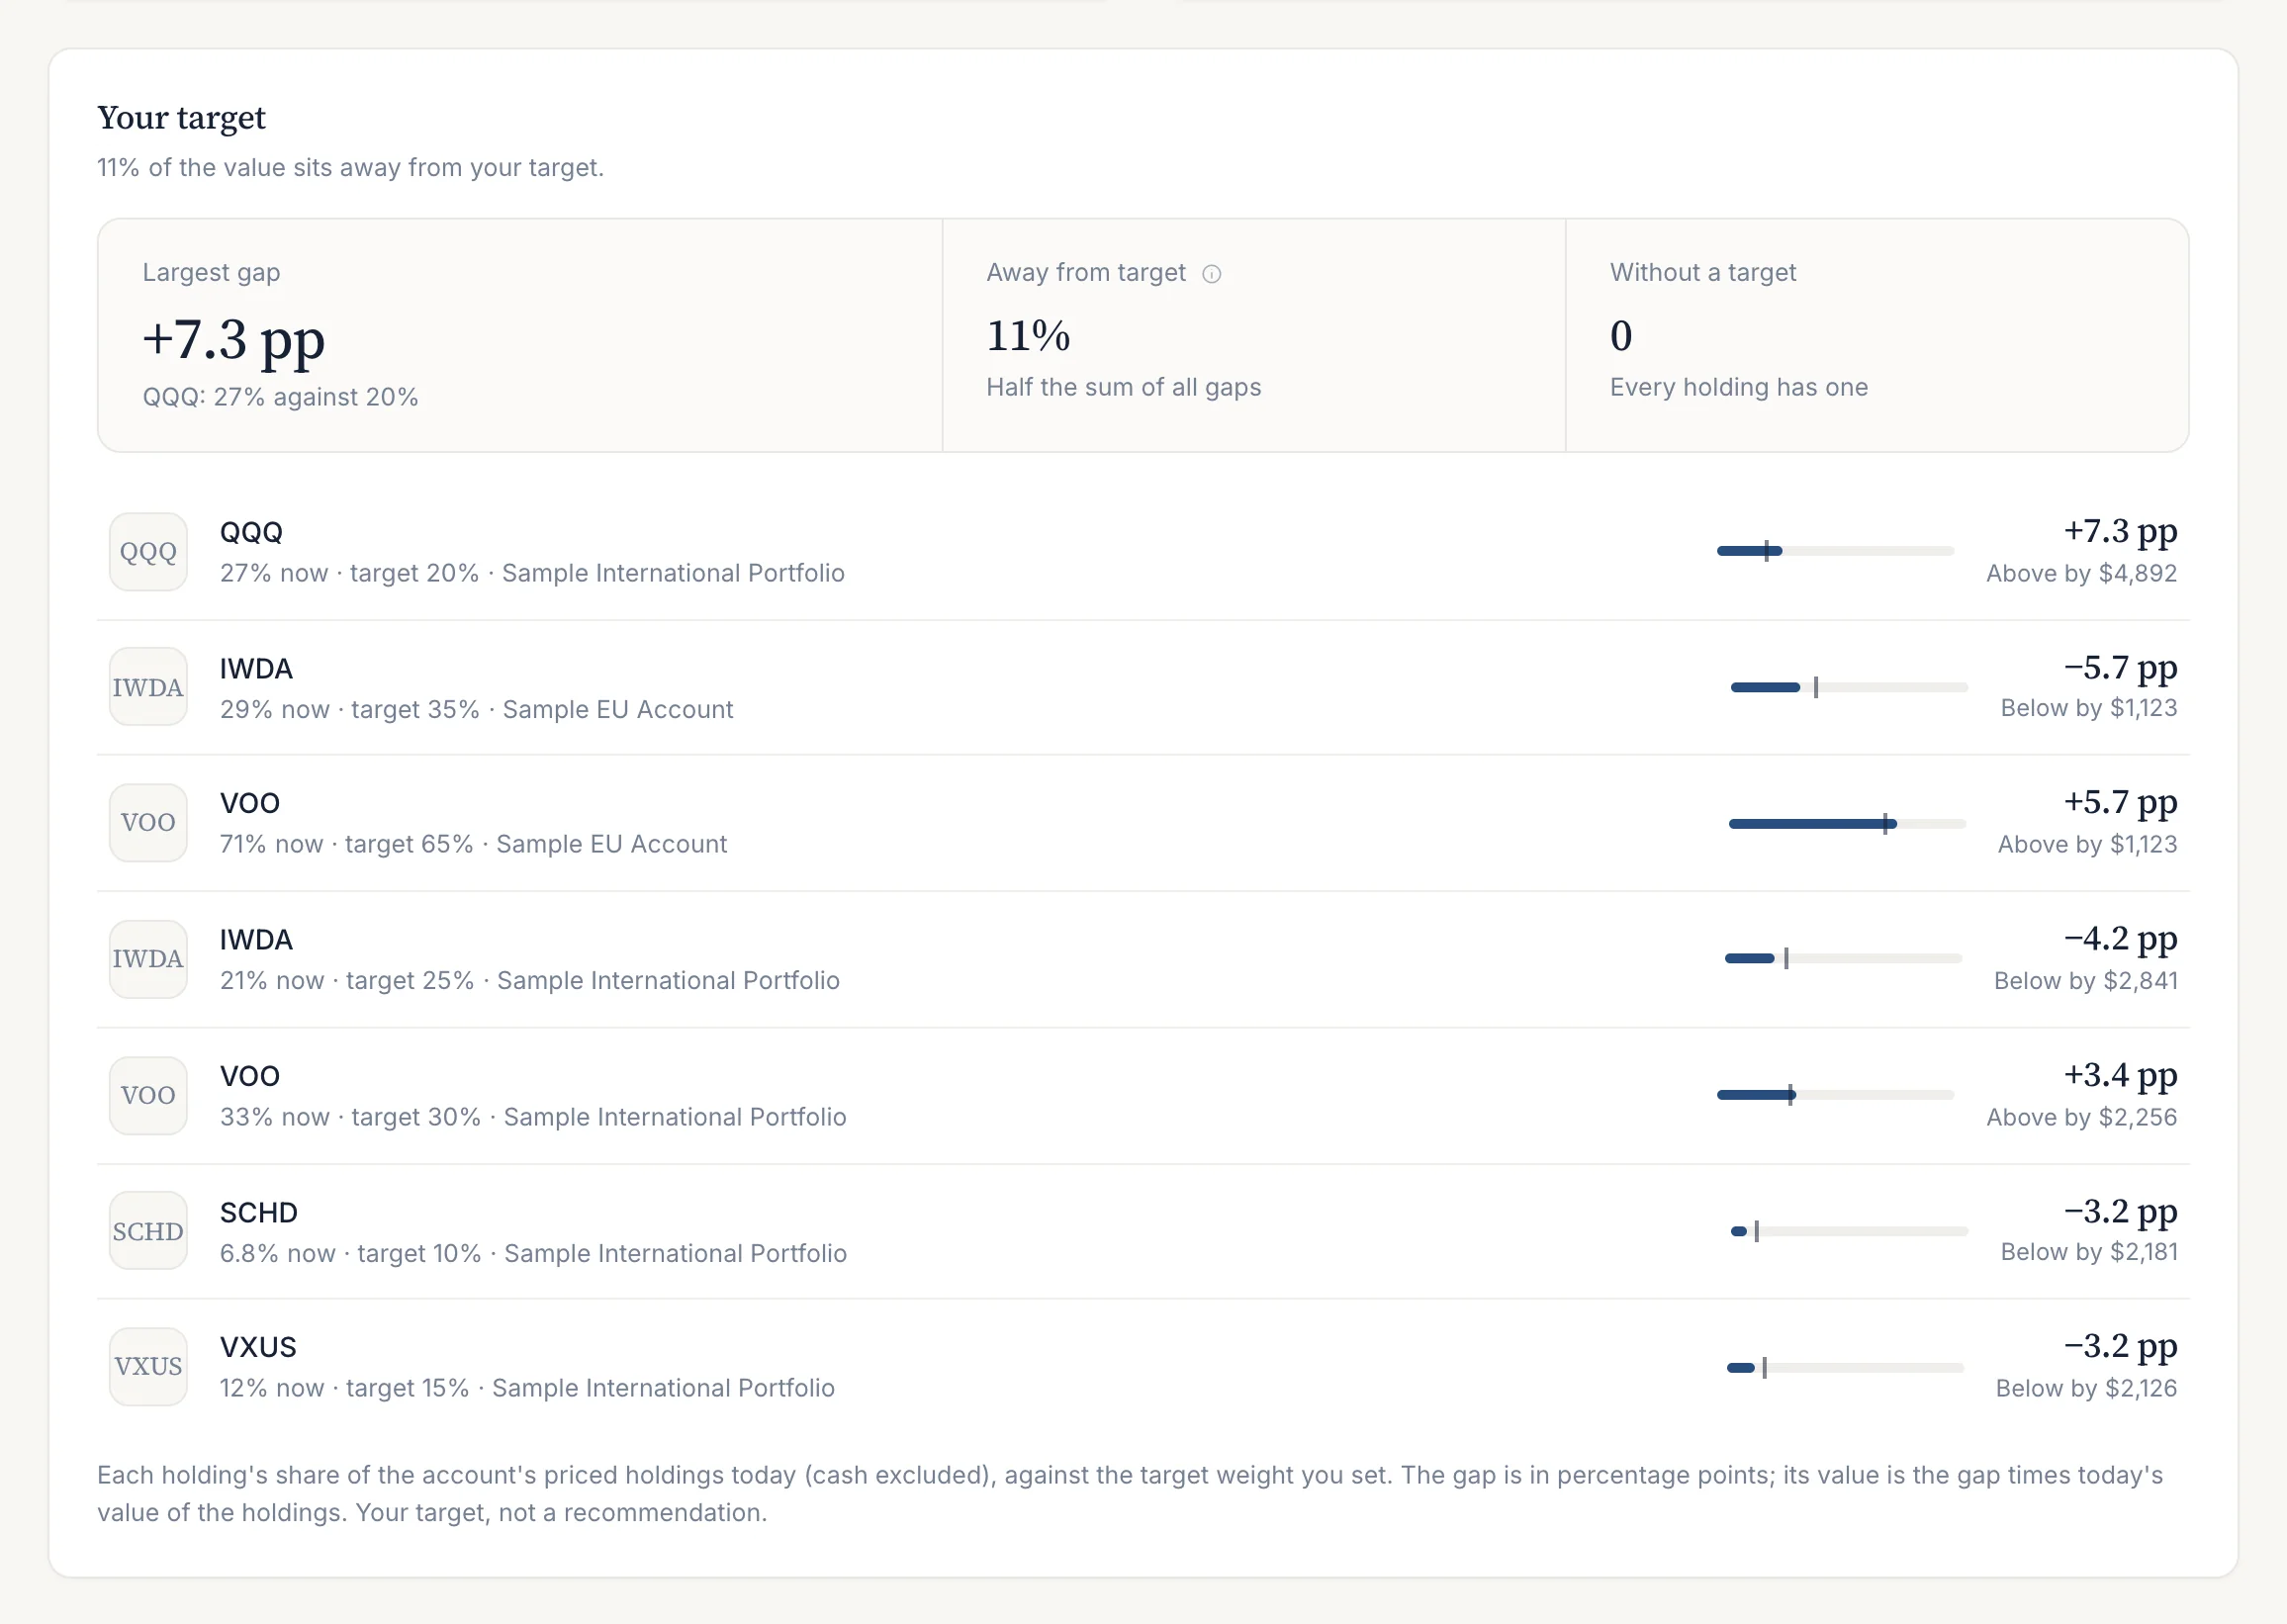
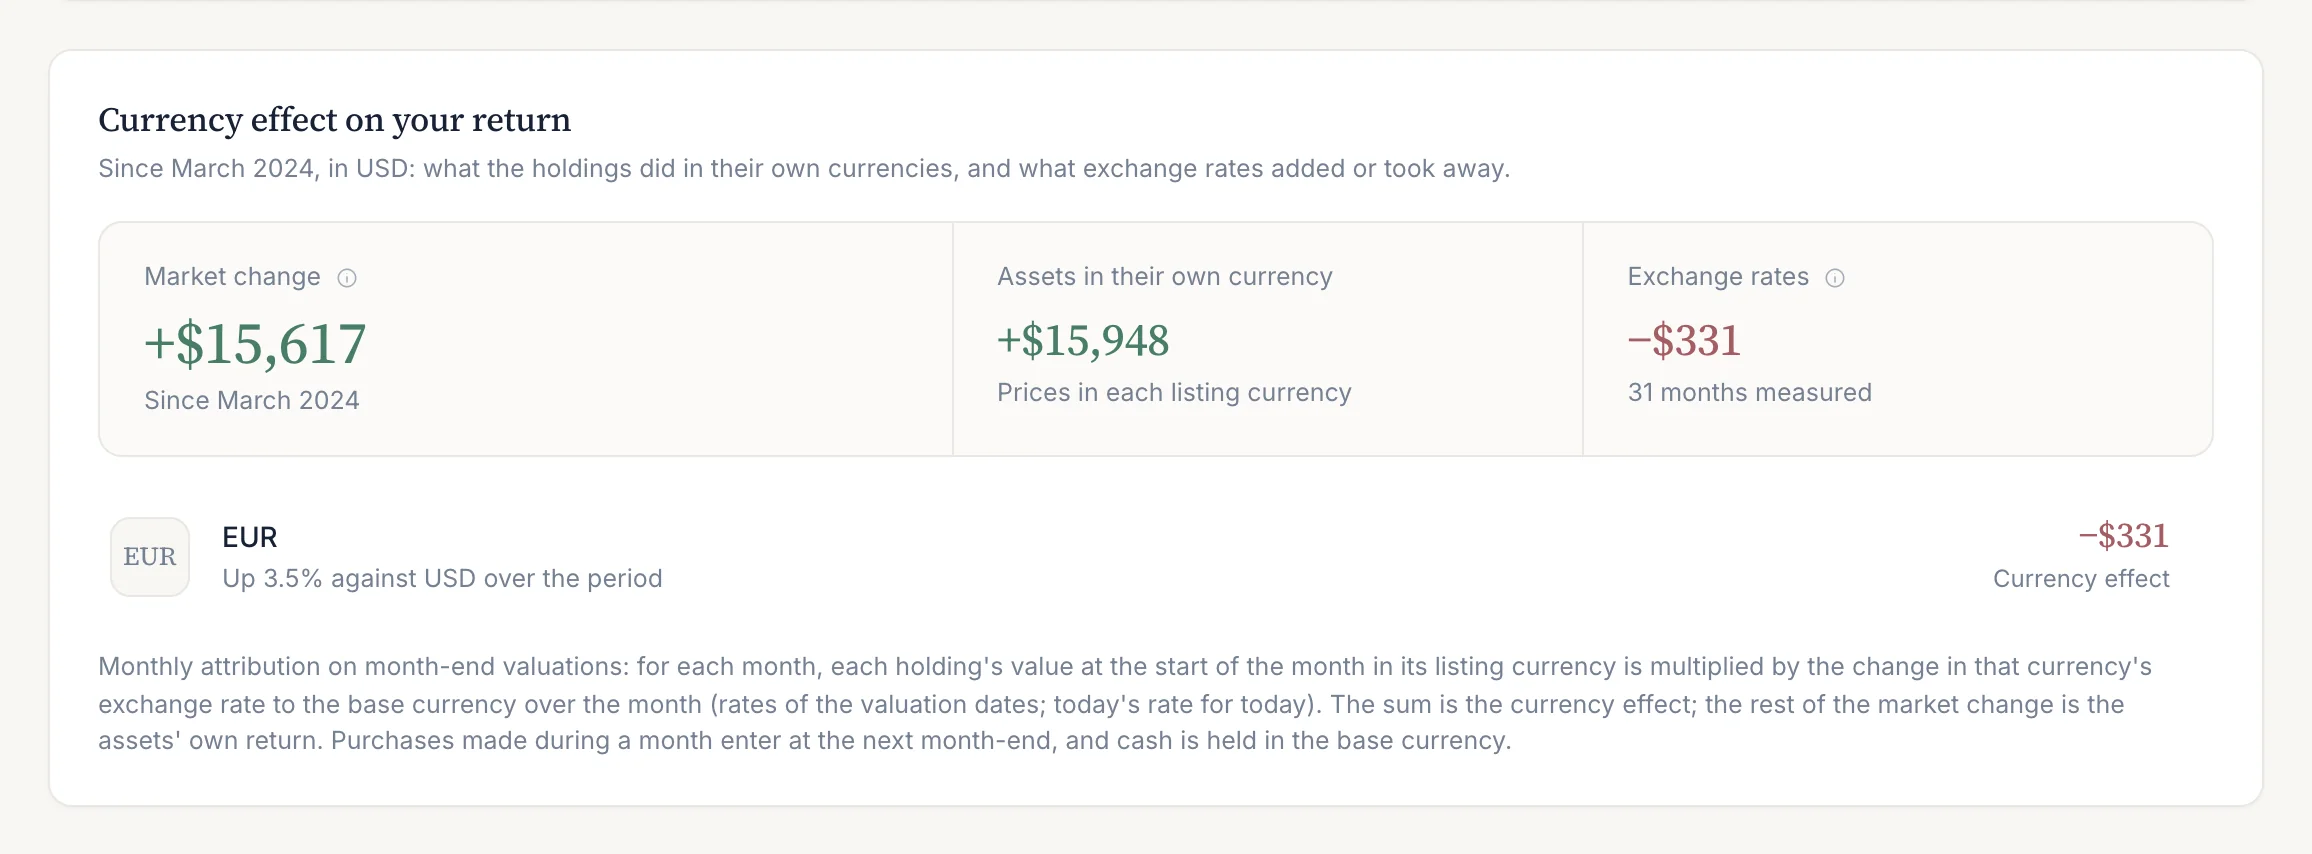
Exposure (/insights/exposure) shows what your money depends on: the largest holding, the three largest, the share outside your currency and the share in US-domiciled funds. Below are concentration by position, currency (the listing currency each holding is priced in), fund domicile, and the split between funds and shares. Observations appear above set thresholds, which are a reading aid, not a target. Shares are shown only once every holding is priced.
Independence
How far you are from financial independence under a stated return. See Independence.
Last updated . Describes the Borderfolio app as built; screenshots are from the sample portfolio. Figures in the app are informational estimates, not tax, legal or investment advice.