Performance
Performance separates what came from your money from what came from markets. Every line is read from your statements, and the lines must add up to the portfolio's value, or the table is not shown.
Choosing a period
Insights → Performance covers Since inception by default. YTD, 1Y and Custom (two dates) change the period for everything on the page. Performance works on one portfolio or on all of them combined.
How your wealth was built
The first section is a waterfall: the value at the start of the period (if it was not zero), plus net contributions, plus market gains, plus dividends and interest, less broker fees and less tax withheld at source, equals the current portfolio value, of which uninvested cash is shown separately. Positions that failed to import are named as a line of their own rather than hidden in another figure.
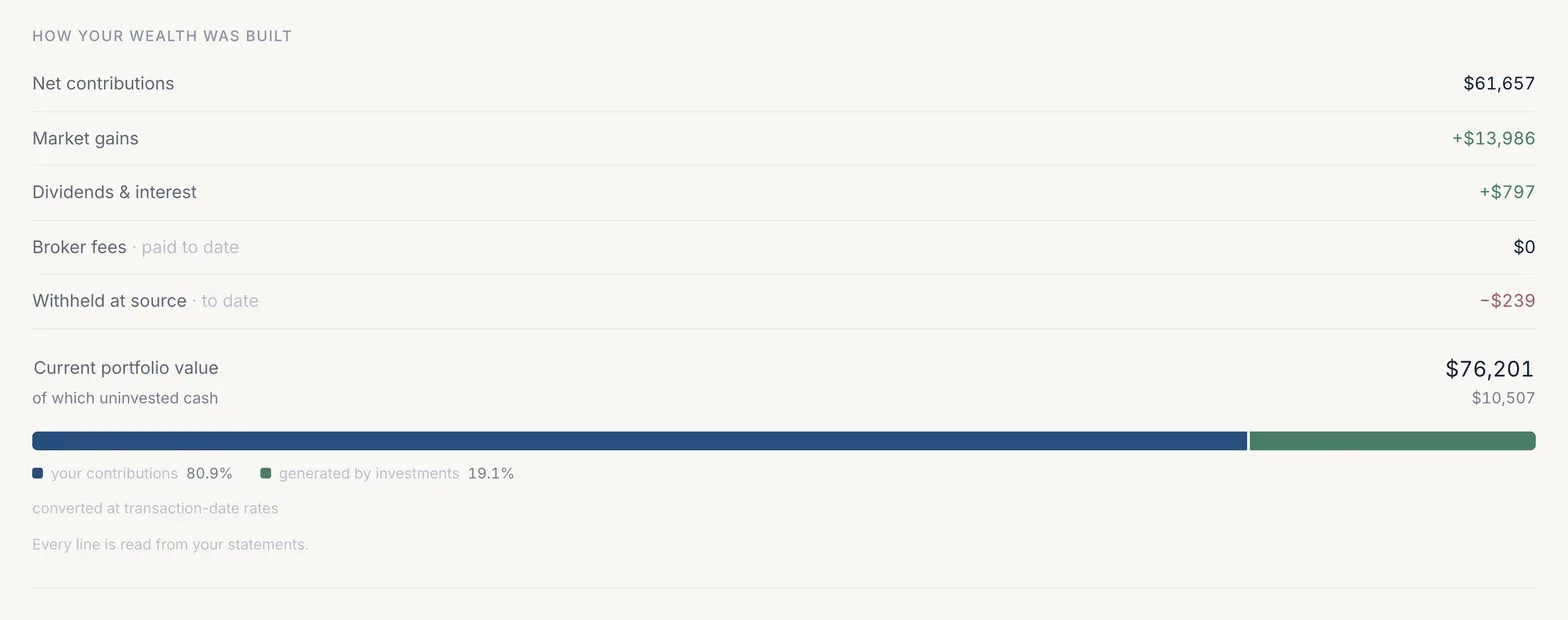
The bar beneath shows the same total as a split between your contributions and what the investments generated. If the period lost money, the heading becomes Where your money went and two bars compare what you put in with what you have now.
Portfolio growth
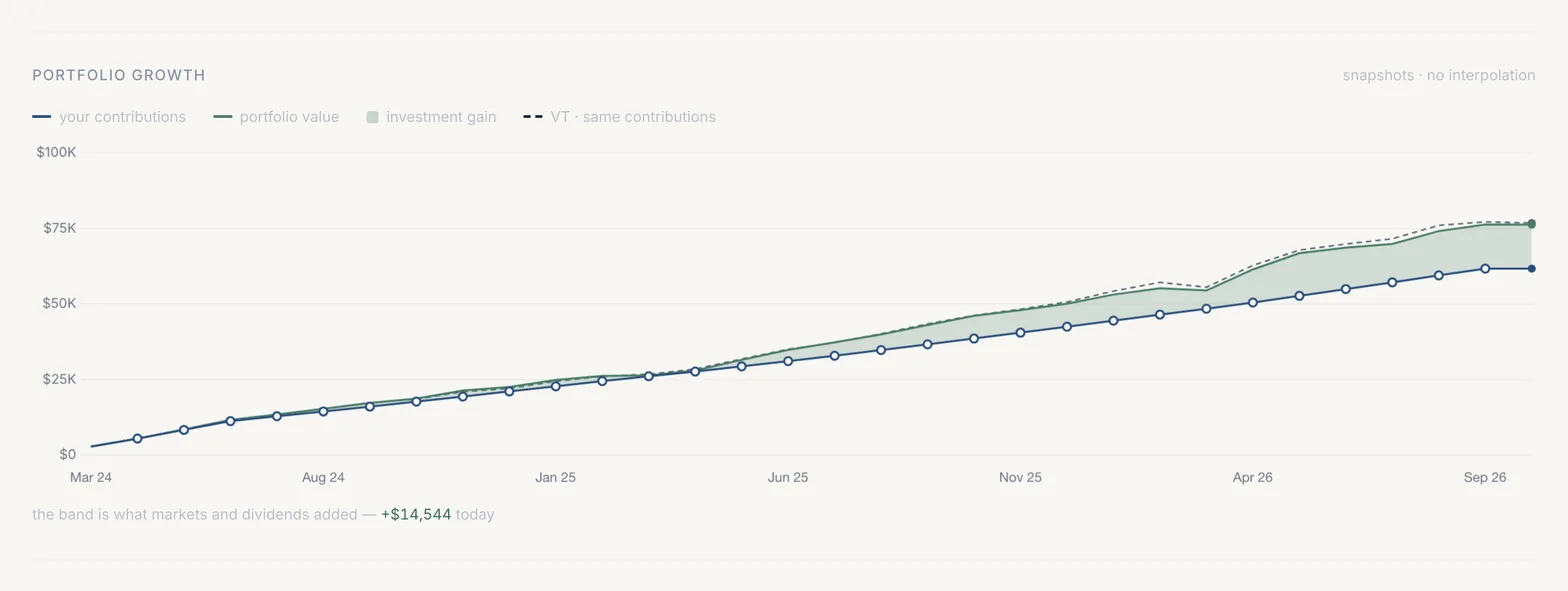
The chart draws your contributions and the portfolio's value over time from real snapshots, with no interpolation between them; the band between the two lines is what markets and dividends added. A dashed line shows what the same contributions would have become in VT.
Return metrics
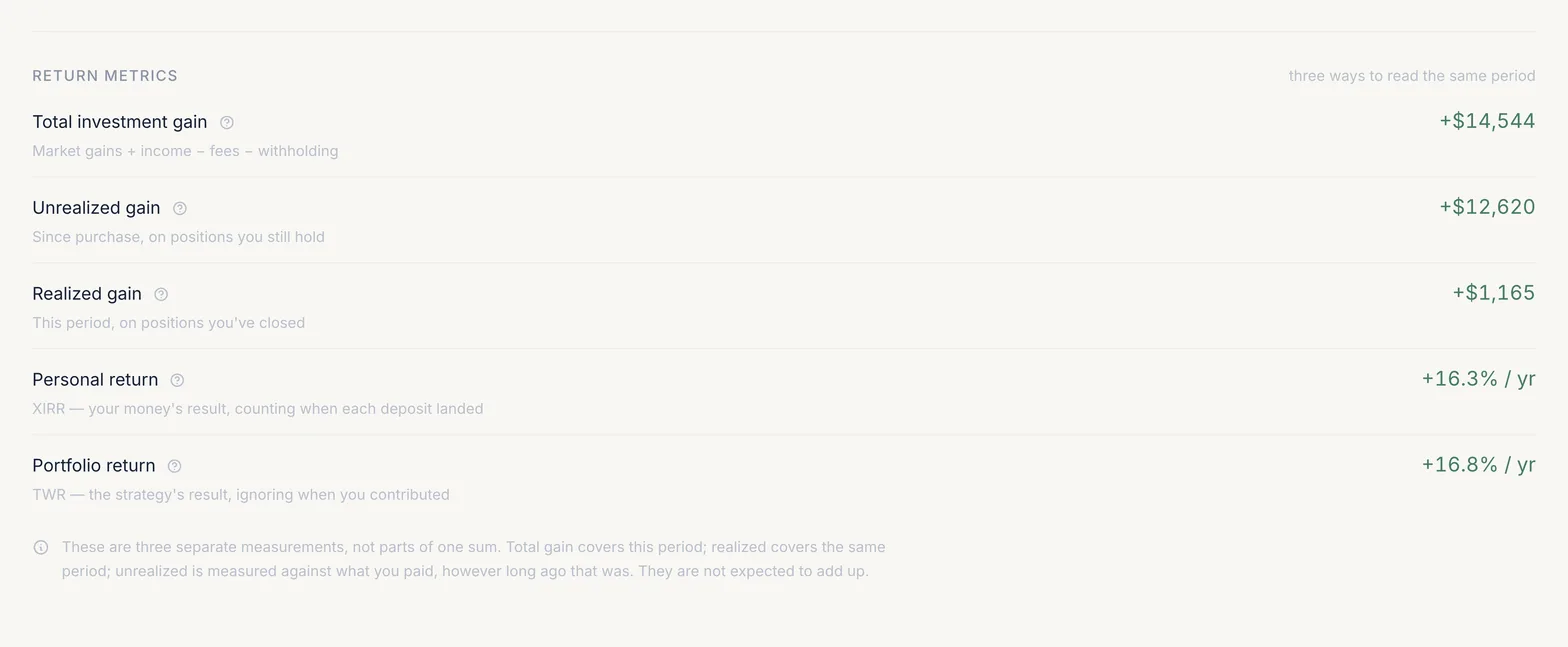
Three ways to read the same period, which are separate measurements and are not expected to add up:
- Total investment gain
- Market gains plus income, less fees and withholding, over the period. Unrealised gain (since purchase, on positions you still hold) and realised gain (on positions closed in the period) are shown beside it.
- Personal return (XIRR)
- Your money's result, counting when each deposit landed: a money-weighted annual rate. Only external deposits count as new money. It needs 90 days of history and a complete ledger; otherwise the row says what is missing.
- Portfolio return (TWR)
- The strategy's result, ignoring when you contributed: returns between known valuations are chain-linked and annualised. It needs the ledger and valuations covering the period.
The difference between the two rates is explained in true return methodology and how to track portfolio performance.
Sharing a performance card
Share makes an image of the period's performance, or of the tax drag, in a wide or square format. You choose how much to reveal (percentages only, rounded amounts or exact amounts) and whether to show top holdings. A public link is optional: it is a frozen snapshot with an unguessable address, never updates, never shows who you are, and can be set to expire.
Last updated . Describes the app at app.borderfolio.app as built; screenshots are from the sample portfolio. Figures in the app are informational estimates, not tax, legal or investment advice.