Planner and independence
Two screens look forward. The Planner models your next contribution before you make it. Independence estimates when your portfolio could cover your spending, from the spending and residency in your profile.
Planner
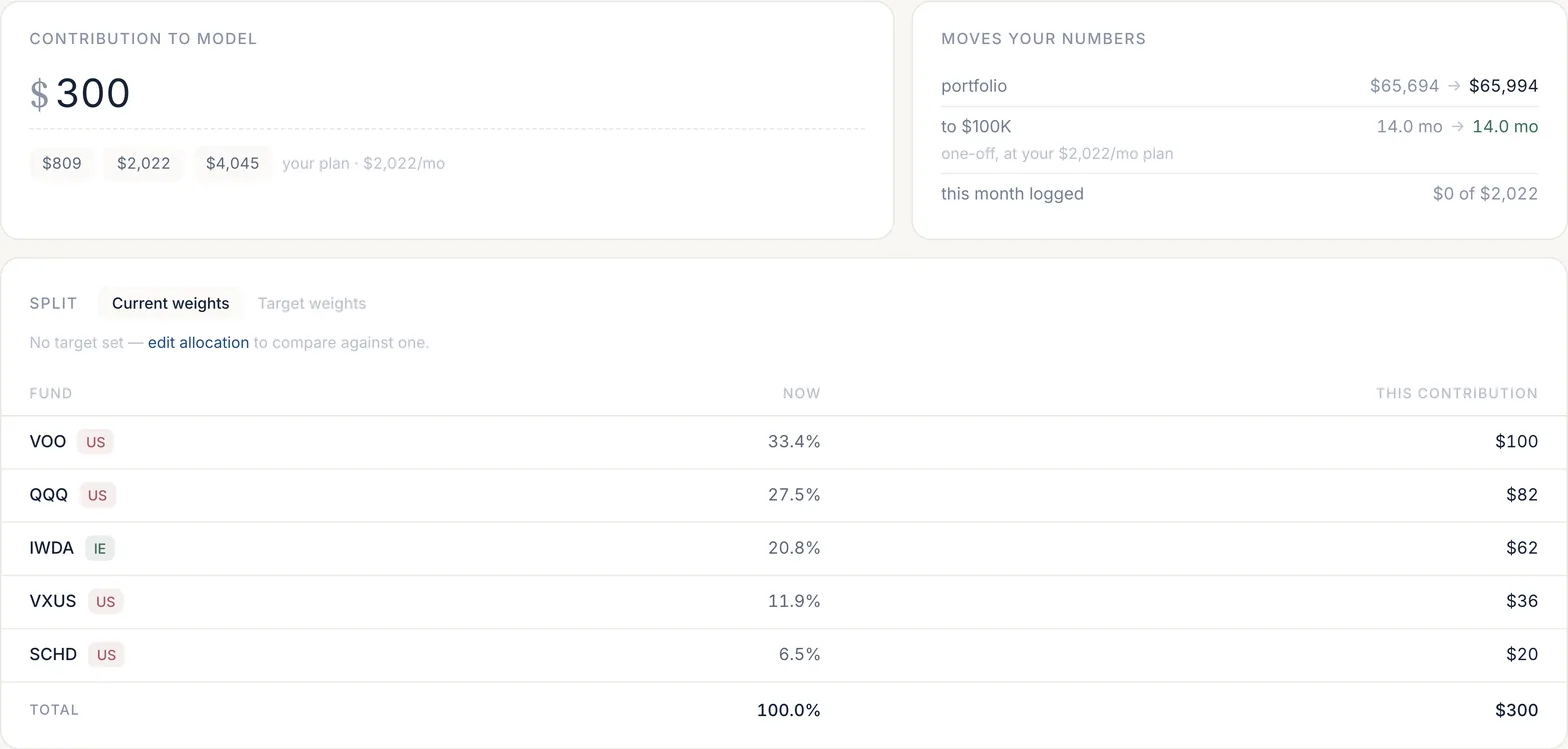
Insights → Planner works on one portfolio. Enter the contribution to model, or pick one of the presets around your monthly plan. Moves your numbers shows what it changes: the portfolio's value, how many months it takes to the next milestone, and how much of this month's plan you have logged.
The split
The split table shows how the contribution would be divided across your holdings, by current weights or, if you set a target allocation, by target weights, with each holding's drift from target. It is a calculation, not an instruction: the planner never buys anything.
Cross-border effect Pro
The cross-border effect shows what the contribution does to your tax position: the change in US-situs exposure against the $60,000 threshold, in annual dividend withholding, and in forward dividends.

Logging what you invested
Log what I invested records the contribution you actually made, by ticker and date, and can update the positions at the same time. It is your own entry; the app does not place trades.
Independence
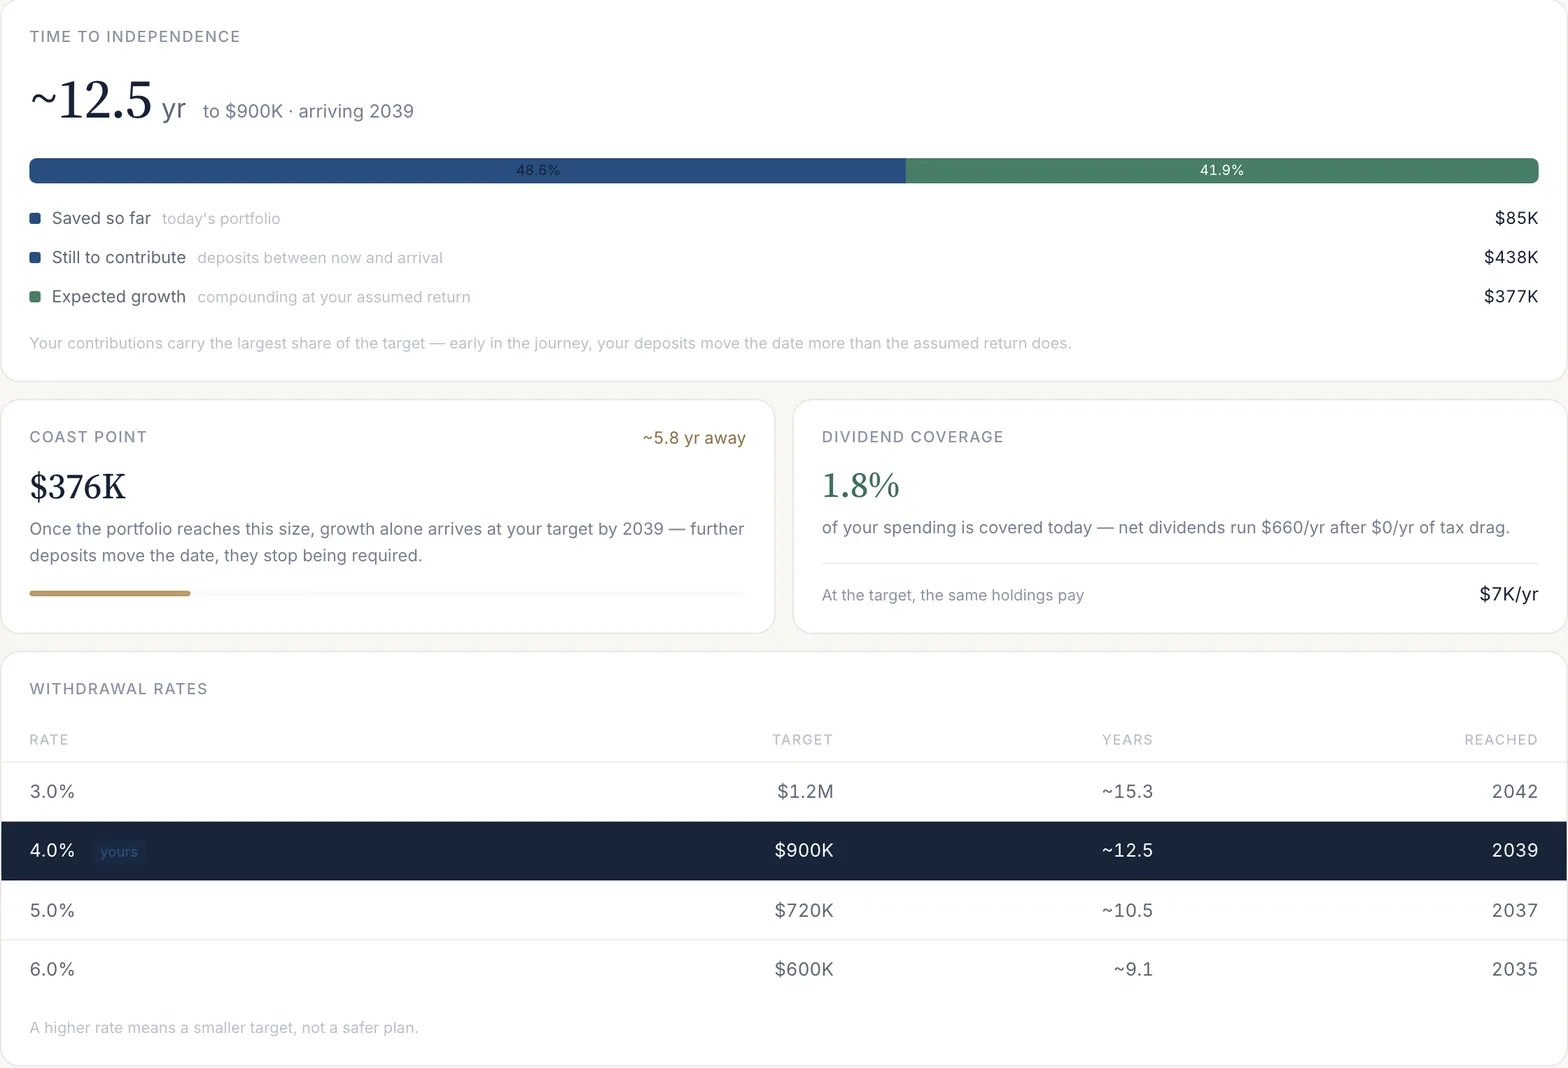
Insights → Independence starts from your monthly spending, set in Residency settings. Your target is annual spending divided by a withdrawal rate; the rate is chosen on the Overview's independence card (3%, 4%, 5% or 6%, with 4% by default).
- Time to independence: roughly how many years until the target, and in which year, split between what you have saved, what you have still to contribute and expected growth.
- Coast point and dividend coverage: when growth alone would carry you to the target, and how much of your spending dividends already cover.
- Withdrawal rates: the target and the years to reach it at each rate. A higher rate means a smaller target, not a safer plan.
- Projected path: your contributions, the portfolio's value and expected growth over time.
The projection assumes about 7% a year of nominal growth, and withholding drag is taken from the Tax calculation. Scenarios Pro compare up to four residences or spending levels side by side: spending, withholding drag, local dividend tax, target and time to independence.
Background reading: what is FIRE?, FIRE tracking and how to track financial independence.
Last updated . Describes the app at app.borderfolio.app as built; screenshots are from the sample portfolio. Figures in the app are informational estimates, not tax, legal or investment advice.