BorderFolio/Blog/Portfolio performance
How to track portfolio performance: XIRR, TWR and the metrics that matter
30 August 2026 · Steffan Kharmaaiarvi · 12 min read
The portfolio in the screenshots below is worth $47,536. Its owner deposited $41,315 of that. So how did they actually do? Every performance metric in this article is an attempt to answer some version of that question, and the reason there are several of them is that "how did I do" is really four different questions wearing one coat.
What this covers
- Step one: take your own money out
- Total investment gain, and the two slices inside it
- Personal return (XIRR): what your money earned
- Portfolio return (TWR): what the strategy earned
- A worked example: +35% and −9.7% in the same year
- The costs most trackers never subtract
- Your tax residence is a performance metric
- A monthly checklist
- FAQ
1. Step one: take your own money out
Before any percentage is worth calculating, the balance has to be split into the things that produced it. A portfolio grows for five separate reasons, and only four of them are performance:
- Contributions — money you added. Not performance, however good it feels.
- Market movement — the change in price of what you hold.
- Income — dividends and interest the holdings paid.
- Fees — commissions the broker charged.
- Tax withheld at source — money deducted from dividends before they ever reached you.
Written as an identity, for any period:
value at start + contributions + market gains + income − fees − withholding = value at end
This is worth insisting on for a reason that sounds pedantic and isn't: if "market gains" is computed as whatever is left over once everything else is subtracted, the identity can never fail — and a number that can never fail is a number you cannot check. Every missing transaction, every unimported position, every rounding error silently becomes "market growth". Measure each term separately and the two sides of the equation are allowed to disagree, which is exactly what makes them worth trusting when they don't.
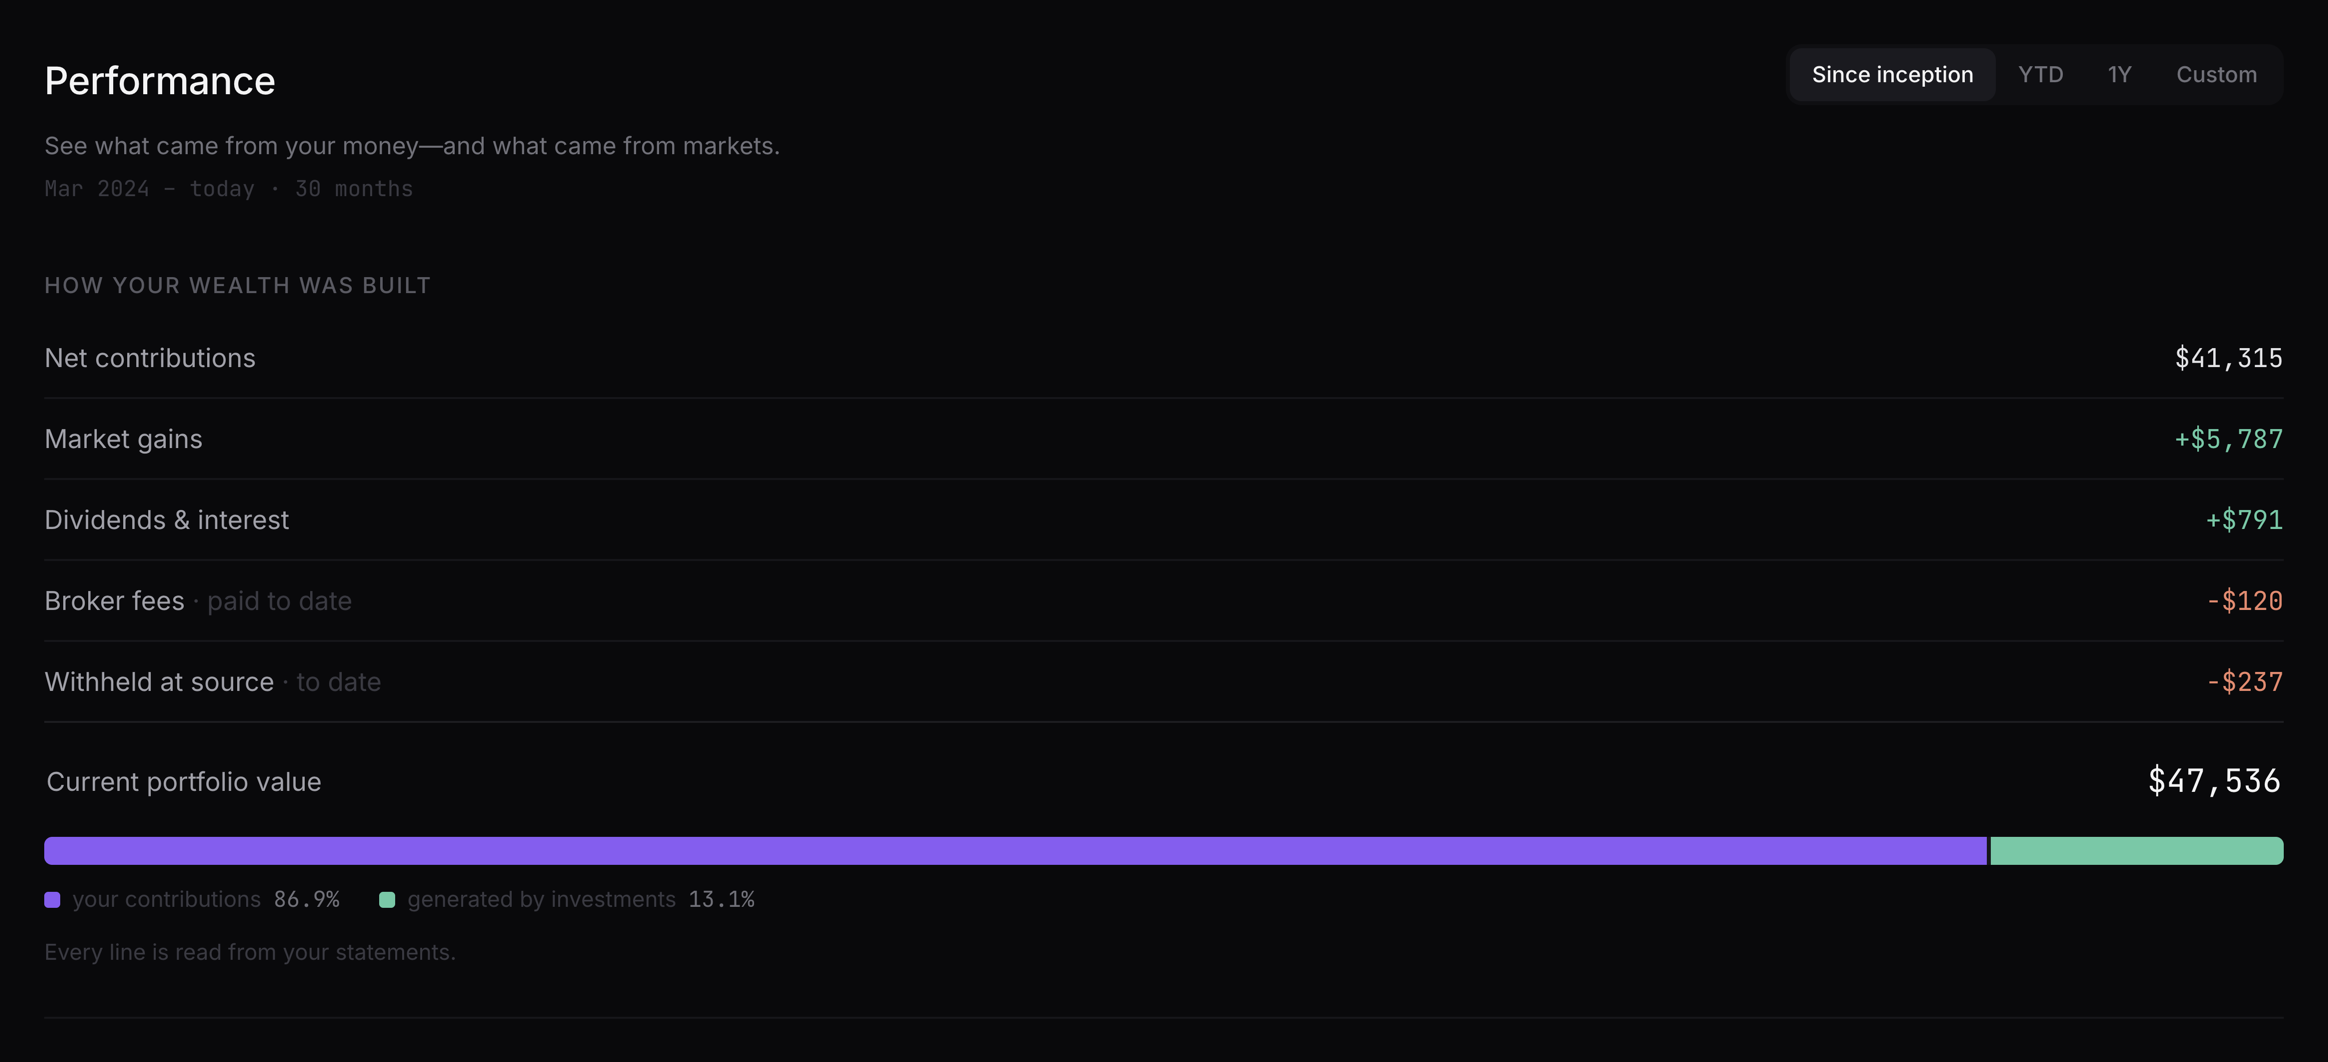
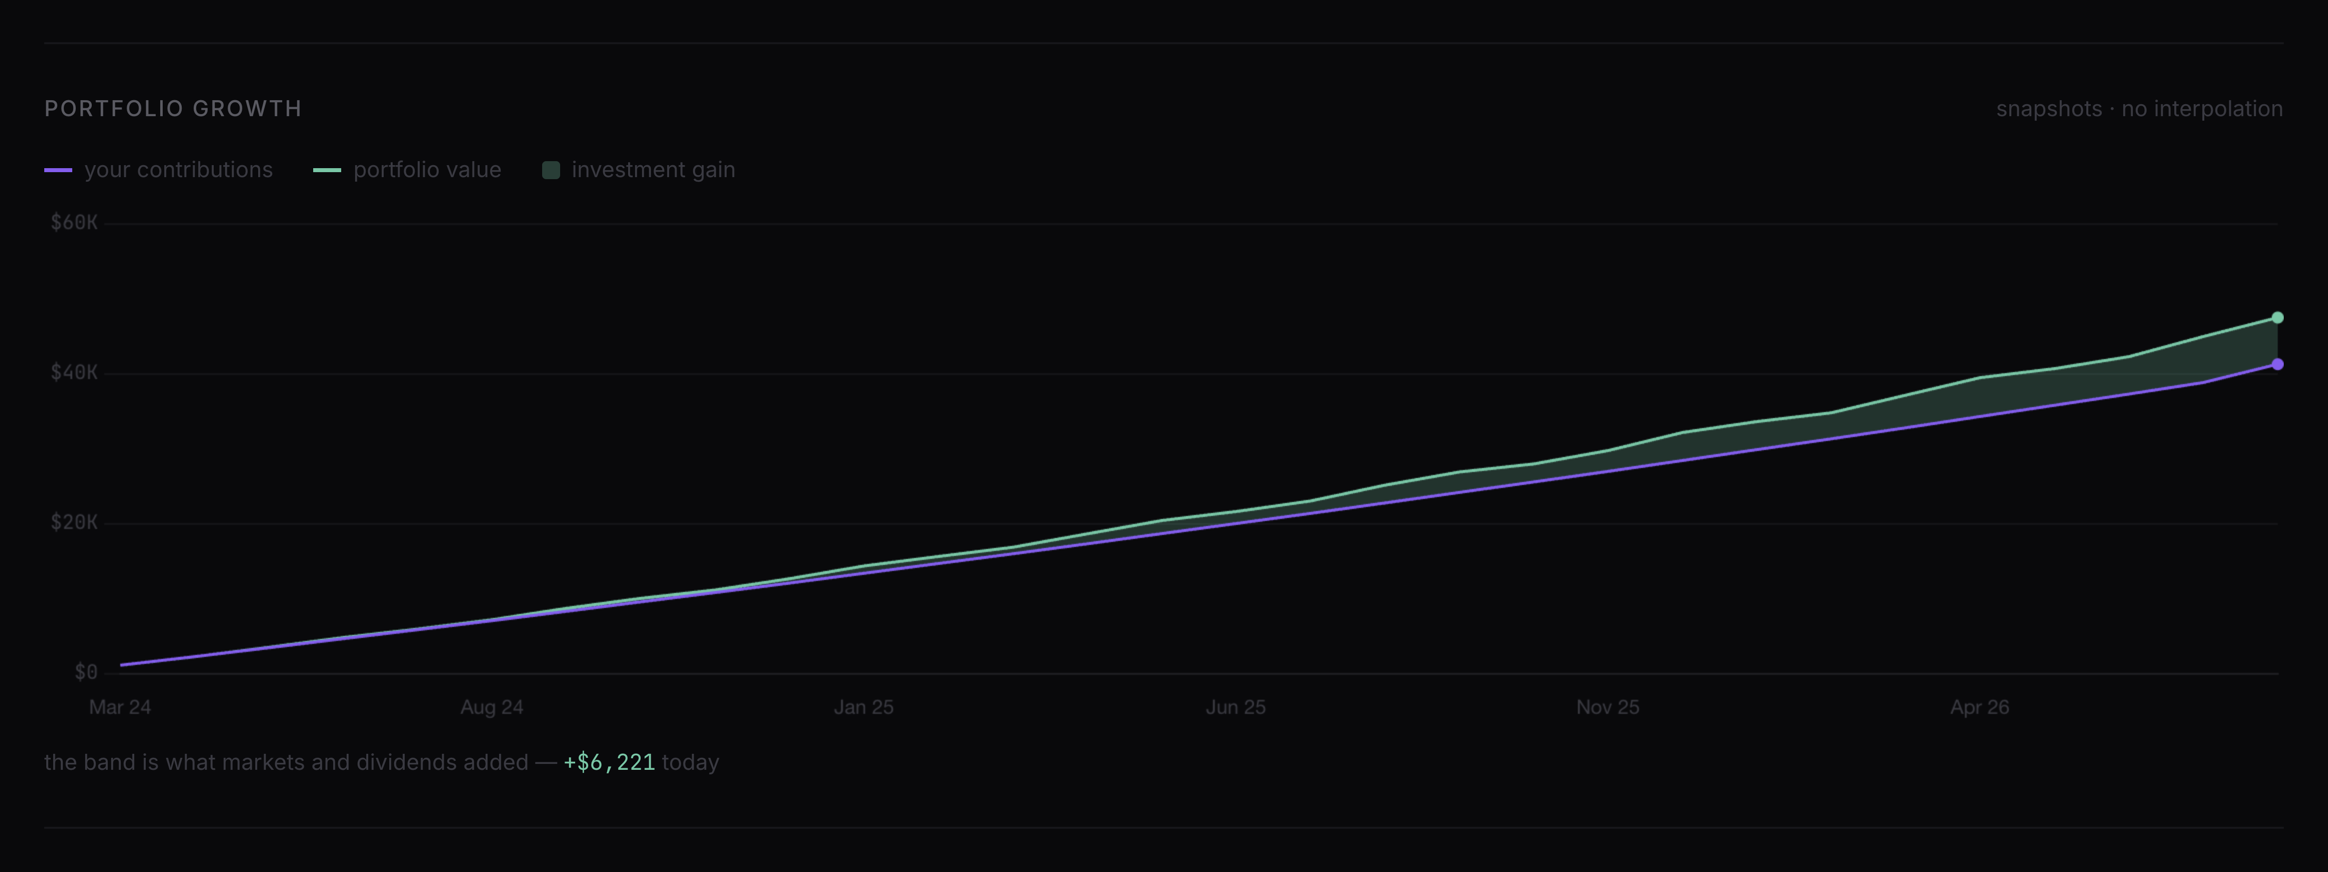
The interesting number here is not $47,536 and not even $6,221. It is the ratio the bar underneath states: 86.9% of this portfolio is money its owner deposited, and 13.1% is what the investments added on top. That is a completely legitimate way to get richer — it is what a savings rate looks like in the first years of a portfolio — and it is exactly the ratio a tracker that shows only a balance line lets you mistake for skill.
2. Total investment gain, and the two slices inside it
Once your deposits are out of the picture, everything the investments actually did is:
total investment gain = market gains + income − fees − withholding
Two other figures cut the same total a different way, and they are frequently confused with additional money:
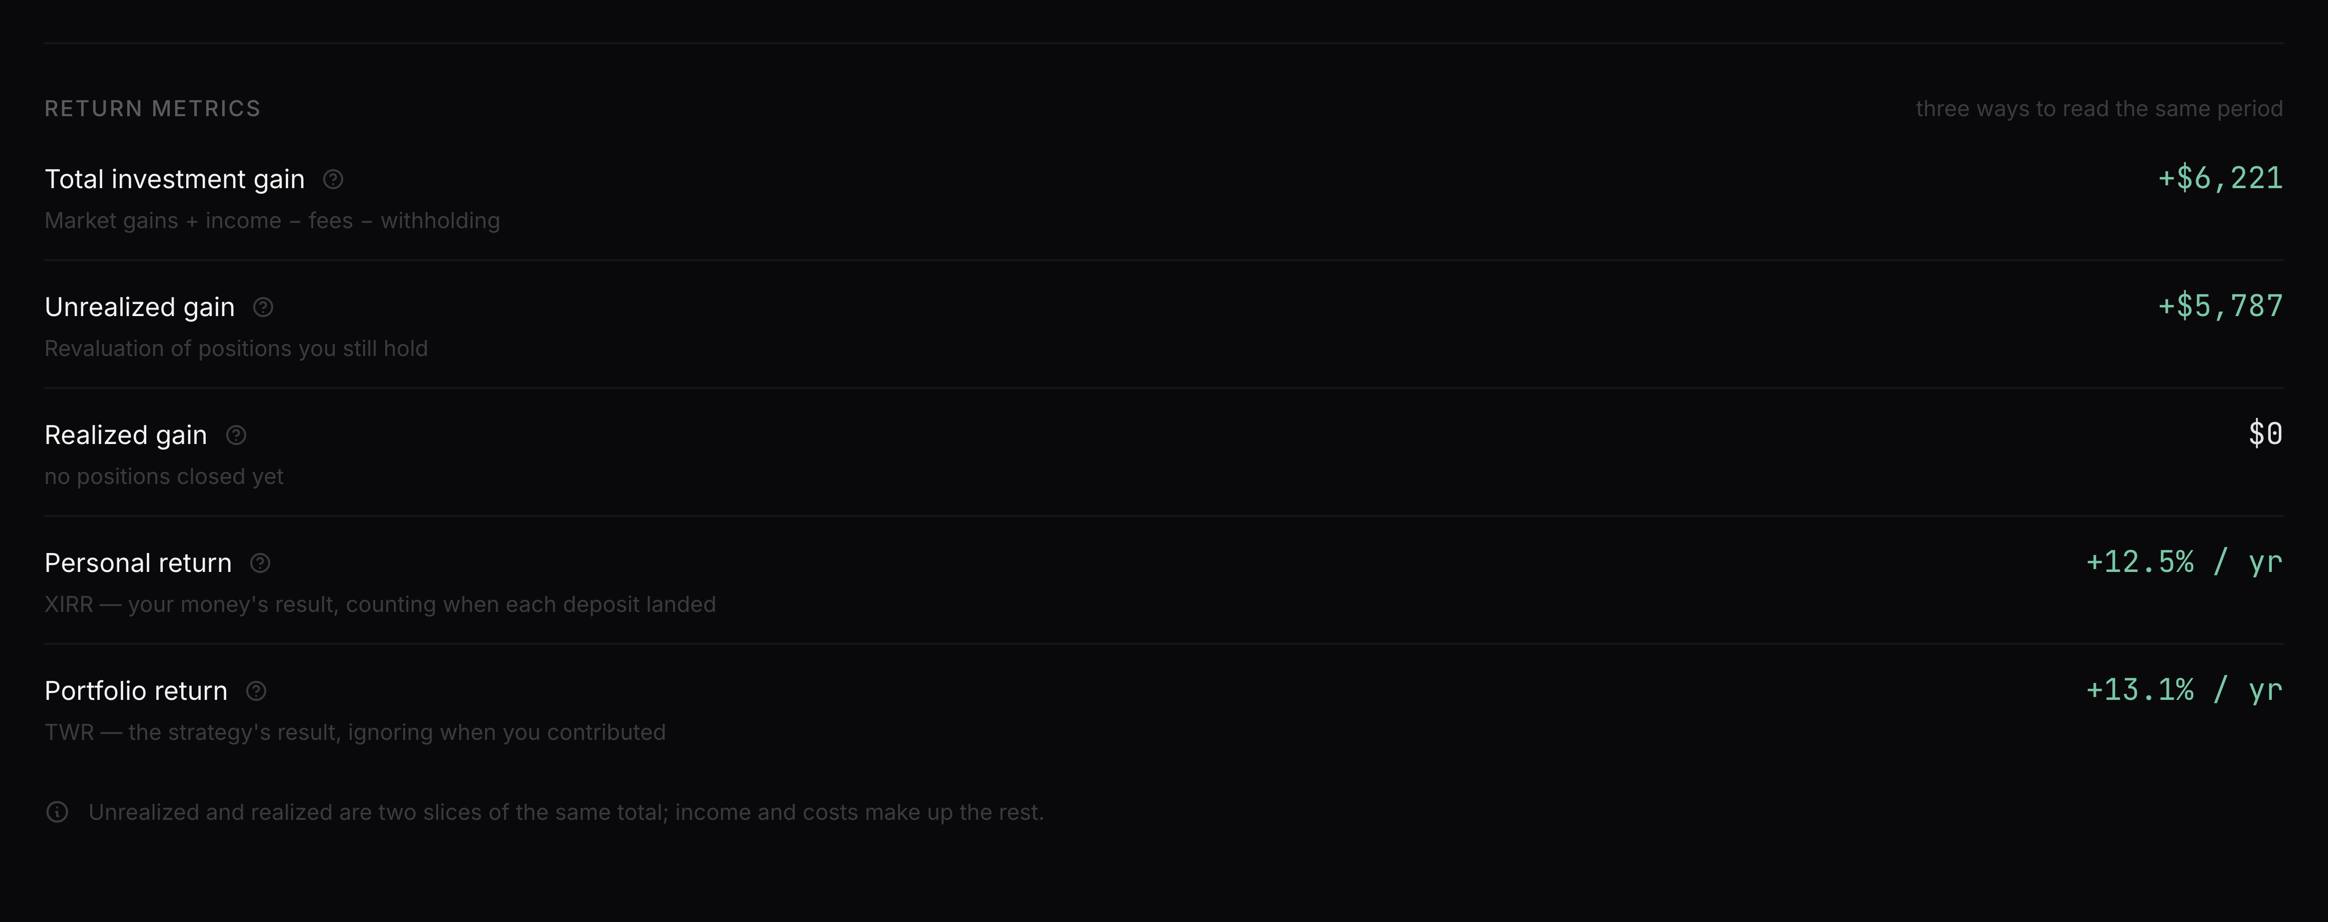
- Unrealized gain — the change in market value of positions you still hold, against what they cost. It is an opinion the market is currently expressing, and it can be withdrawn without notice.
- Realized gain — profit and loss locked in by positions you actually closed during the period. This one is real, spendable, and in most jurisdictions taxable.
Unrealized and realized are two slices of market movement, not extra layers on top of it. Income and costs make up the rest of the total. If a tracker shows all four and they appear to sum to more than the total, it is presenting slices as additions.
In the screenshot below the realized row reads $0 · no positions closed yet, which is the honest answer for a portfolio that has only ever bought — and a different statement from "we could not work it out". A metric that cannot be computed and a metric that computes to zero must not look the same on screen.
3. Personal return (XIRR): what your money earned
XIRR — extended internal rate of return, also called the money-weighted or personal return — is the single annualised rate that, applied to every deposit from the day it landed, produces exactly the value you hold today.
The mechanics: each cash flow is a dated amount (deposits negative, withdrawals and the final value positive), and XIRR is the rate r that solves
Σ Cᵢ / (1 + r)^(dᵢ / 365) = 0
where dᵢ is the number of days from the first flow. There is no closed-form solution; every implementation, including the =XIRR(values, dates) function in Excel and Google Sheets, finds it by iteration.
What matters in practice is the consequence of that date weighting: money that was invested longer counts for more. A $500 deposit in January and a $500 deposit in December are not equal contributors to this year's outcome, and XIRR is the only common metric that admits it. If you are a regular contributor — the entire premise of index investing and of FIRE — this is the number that describes your actual experience.
XIRR and CAGR are the same thing when there is only one deposit. CAGR assumes a single lump sum, untouched. The moment you add a second contribution, CAGR has no defined answer and XIRR does.
What XIRR cannot do is tell you whether your choices were good. It rewards having had a lot of money invested during a rising market, which is partly luck of timing, and it punishes the opposite. That is a feature when you are asking "how am I doing", and a bug when you are asking "was this fund worth holding".
4. Portfolio return (TWR): what the strategy earned
TWR — time-weighted return — answers the other question. It cuts the period at every cash flow, computes the return of each sub-period on its own, and chains them together:
TWR = (1 + r₁) × (1 + r₂) × … × (1 + rₙ) − 1
Because each sub-period return is a pure percentage, the size of the deposits cancels out entirely. A $10 portfolio and a $10 million portfolio holding the same thing get the same TWR. This is why every fund and index publishes a time-weighted number: it is the only way to compare two strategies without the comparison being contaminated by who happened to deposit more.
TWR is also the more demanding number to compute honestly. It needs a valuation of the portfolio on the date of every flow. Where an exact valuation is missing, the standard workaround is a Modified Dietz weighting of the flow inside the sub-period — a good approximation, but an approximation, and one that should be labelled as such rather than blended silently into a headline figure.
5. A worked example: +35% and −9.7% in the same year
The clearest way to see that these are different questions is a year where the two answers point in opposite directions.
| Date | Event | Portfolio value |
|---|---|---|
| 1 Jan | Deposit $1,000 | $1,000 |
| 1 Jul | Holdings have risen 50% | $1,500 |
| 1 Jul | Deposit $9,000 — the plan is working | $10,500 |
| 31 Dec | Holdings fall 10% | $9,450 |
Time-weighted return. Two sub-periods: +50% and −10%. Chained: 1.50 × 0.90 − 1 = +35%. The strategy had an excellent year.
Money-weighted return. Flows of −$1,000 on 1 Jan, −$9,000 on 1 Jul, +$9,450 on 31 Dec solve to an XIRR of about −9.7%. You put in $10,000 and ended with $9,450.
Both numbers are correct. The strategy returned +35%; the investor lost $550, because 90% of the money only showed up for the bad half. Any tracker that reports one of these and calls it "your return" is answering a question you did not necessarily ask.
| Personal return (XIRR) | Portfolio return (TWR) | |
|---|---|---|
| Answers | What did my money earn? | How did the strategy do? |
| Affected by deposit timing | Yes — that is the point | No — cancelled out by design |
| Comparable to an index | No | Yes |
| Needs valuations at every flow | No | Yes |
| Use it when | Judging your own progress and savings plan | Judging a fund, an allocation or a manager |
Track both. When they diverge sharply, the gap itself is the finding: it means the timing of your contributions, not the holdings, dominated your year.
6. The costs most trackers never subtract
Three drains rarely appear on a performance screen, because none of them show up as a transaction you can see.
Dividend tax withheld at source. It is deducted before the money reaches your account, so a return computed on gross dividends counts money you never received. For a non-US investor in a US-domiciled fund the statutory rate is 30%; a tax treaty commonly reduces it to 15%, and only if the broker holds a valid W-8BEN for you.
The fund's expense ratio. It is charged against the whole position, every year, and never appears on a statement line — it is simply absorbed into the price. On a low-yield fund it can easily exceed the withholding.
Exchange rates on the wrong date. If a tracker converts a EUR deposit from three years ago at today's rate, your contribution history quietly resizes itself every time the currency moves. Flows belong at the rate on the day of the trade; only what you hold today belongs at today's rate.
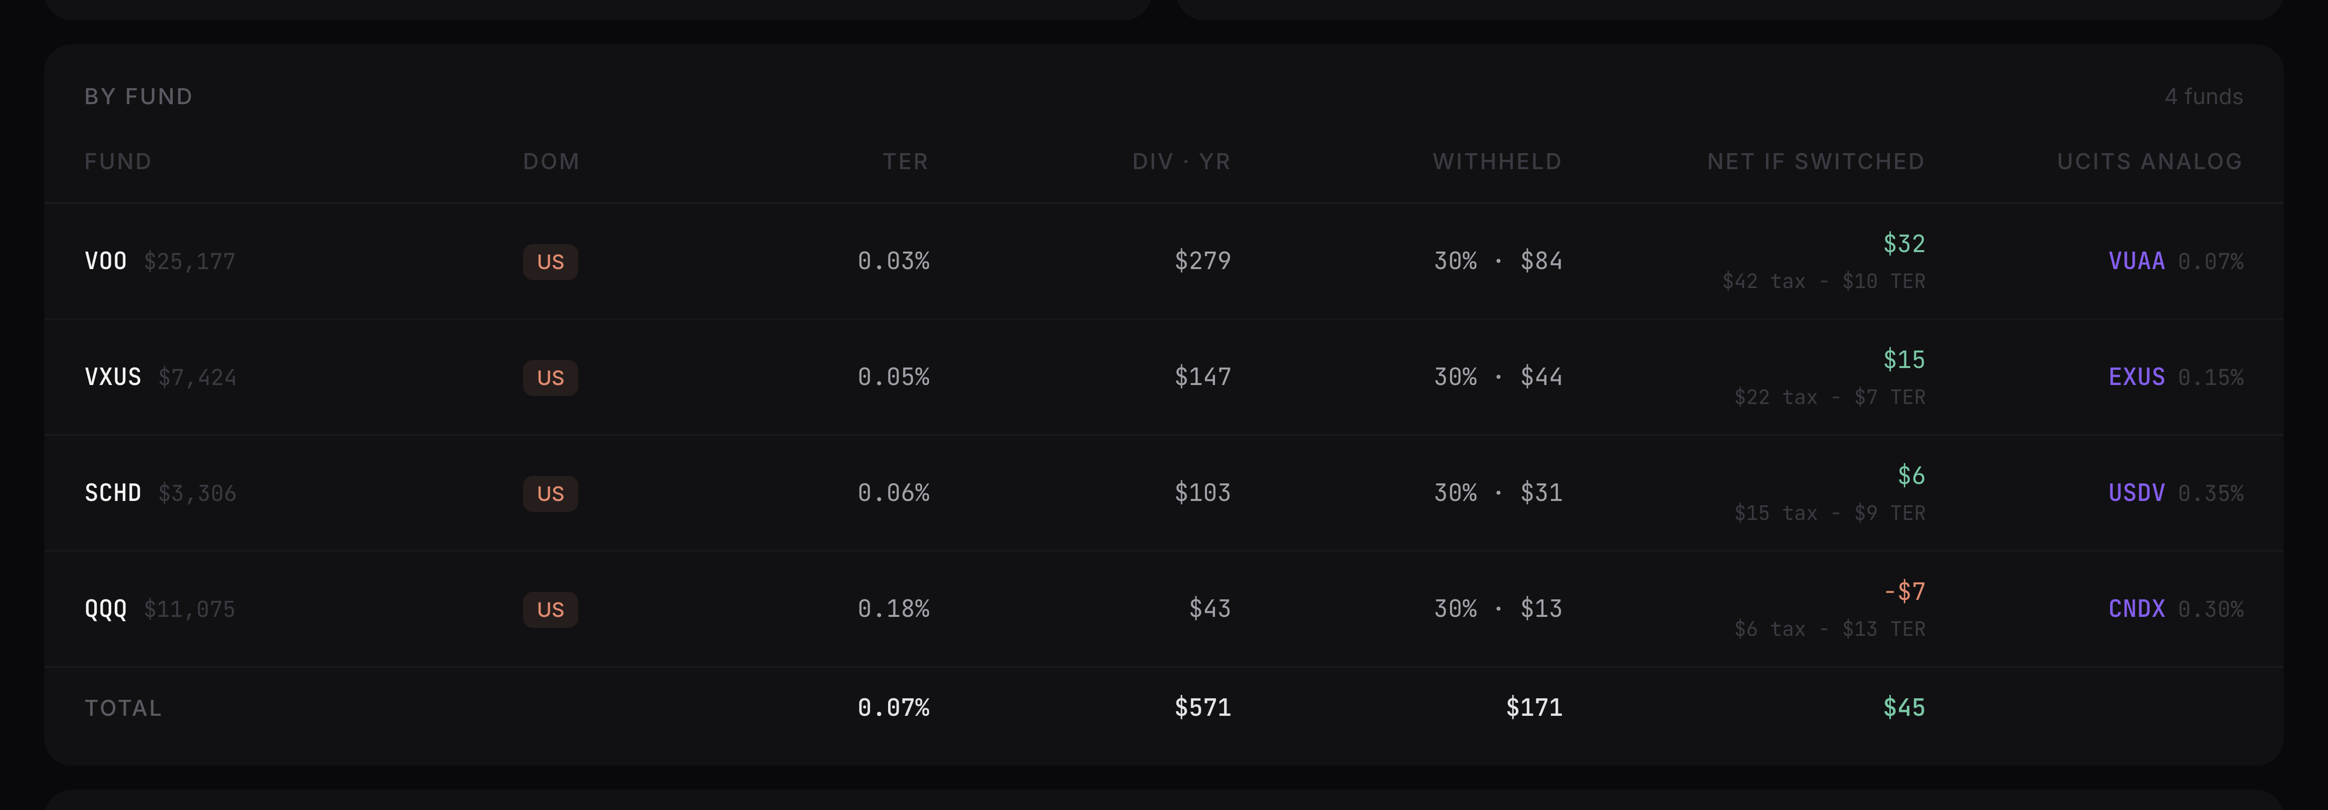
The second and third only matter when you compare alternatives — which is exactly what people do with fund domicile:
7. Your tax residence is a performance metric
This is the part that has no equivalent in a domestic tracker. Two people can hold the identical fund, in the identical amount, on the identical dates, and keep different amounts of the dividend — because withholding is decided by the fund's country and the investor's country together.
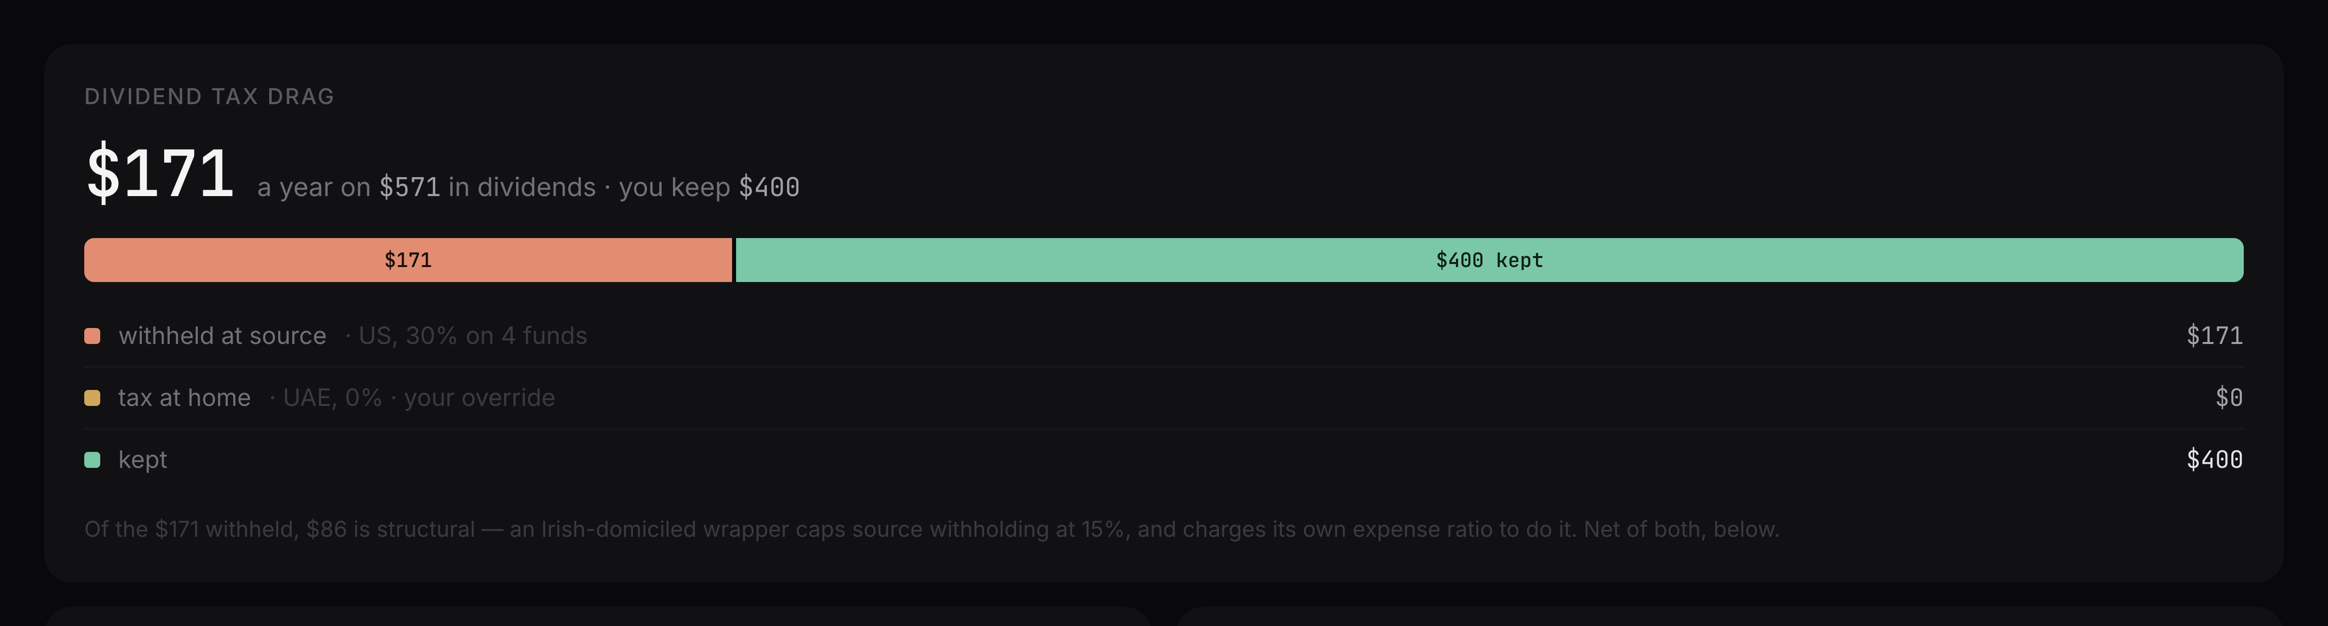
The demo portfolio above throws off $571 of gross dividends a year, all of it from US-domiciled funds. Here is the first step alone — what the United States takes before any home-country tax exists:
| Tax residence | US treaty status | Withheld at source | Reaches you |
|---|---|---|---|
| United Arab Emirates | No US tax treaty | 30% · $171 | $400 |
| Portugal | Treaty rate on portfolio dividends | 15% · $86 | $485 |
| Germany | Treaty rate on portfolio dividends | 15% · $86 | $485 |
That is $85 a year of difference on an identical portfolio, before anyone has picked a single stock — and it recurs every year, compounding against you. On a portfolio ten times the size it is $850. The treaty rate is not automatic either: it applies only where the broker holds valid documentation for you.
Then comes the second step, at home, and it is genuinely different everywhere: some residences tax the dividend again at a flat rate, some at a marginal rate, some credit the tax already withheld, and some — the UAE among them — add nothing at all. A zero-income-tax residence does not make the first step disappear, which surprises a great many people who move specifically for the tax.
There is a third country effect that almost nobody is told about: US estate tax on US-situs assets. A non-resident holding more than $60,000 of US-domiciled securities can face estate tax of up to 40% on the excess — how much, if any, depends on treaty relief, available deductions and the circumstances of the estate. The threshold itself has nothing to do with income tax, and a long-term index investor crosses it quietly, in an ordinary year, without any event marking it.
8. A monthly checklist
Once a month, after the statement lands, is enough. Daily checking measures your anxiety, not your portfolio.
- Contributed this month — the one number entirely under your control, and the one that dominates the first decade.
- Market movement, separately — so a good month of saving is never mistaken for a good month of investing.
- Income received — and whether it was reinvested or left as cash.
- Costs paid to date — fees and withholding, as amounts, not percentages.
- Personal return vs portfolio return — and specifically the gap between them.
- US-situs exposure — if you are a non-US investor, against the $60,000 line.
- Whether last month's history still says what it said — a tracker that recomputes the past every time a rate moves is not keeping a history.
Most of this is arithmetic you can run in a spreadsheet, and for a single-currency, single-broker portfolio a spreadsheet is genuinely fine. It stops being fine at the point where statements arrive in three formats, dividends arrive net of a withholding rate you have to look up per fund, and half the flows are in a currency that needs the rate from the trade date rather than today's.
That is the point BorderFolio was built for: import the statements, keep the contribution history immutable, and let the performance breakdown, the cross-border layer and the monthly snapshots come out of the same set of confirmed transactions rather than three tools that disagree.
FAQ
What is a good XIRR?
There is no universal answer, and anyone quoting one is selling something. The only honest comparison is against the time-weighted return of a portfolio you could have held instead — that is precisely why both numbers exist. What a personal return can tell you on its own is whether your contributions are doing the heavy lifting, which in the first years of a portfolio they almost always are.
Why doesn't my tracker's return match my broker's?
Usually one of four reasons: the broker counts deposits as growth; the broker reports gross dividends before withholding; the two use different start dates; or foreign-currency flows are being converted at different rates. The fourth is the sneakiest, because it makes last year's numbers change quietly this year.
Can I just calculate this in a spreadsheet?
Yes — =XIRR(values, dates) is built into both Excel and Google Sheets, deposits negative, current value positive. Time-weighted return is harder, because it needs the portfolio's value on the date of every flow, which is the piece a spreadsheet cannot reconstruct after the fact.
Do I need to track withholding if my country taxes foreign dividends anyway?
Yes, and separately. The tax withheld abroad and the tax due at home are two different steps with different rules, and in many residences the first can be credited against the second — but only up to the treaty rate. Anything withheld above it is usually not recoverable at all without filing in the source country.
Where can I see these metrics on my own portfolio?
BorderFolio's Performance page shows the full decomposition, total gain, and the realized/unrealized split for any period; the cross-border layer resolves withholding per fund from domicile and your configured residence. The free tier covers one portfolio with up to ten holdings and three statement imports a month.
Informational and educational content only. Nothing here is investment, tax or legal advice, and no figure in this article is a recommendation to buy, sell or hold any security. Sample values are illustrative. See the investment & tax disclaimer.