BorderFolio/Blog/Interactive Brokers portfolio analysis
Interactive Brokers portfolio analysis for international investors: what IBKR doesn’t show you
Interactive Brokers gives retail investors the most complete raw record in the business. Every fill, every fee, every currency conversion, every corporate action, in a document you can export back to the day the account opened. What it does not give you — what it cannot give you — is an answer to the question an investor living in one country and holding funds domiciled in another actually has. The statement knows the exchange and the currency. It does not know the domicile. It does not know where you live. And it has no field at all for how much of that balance is simply money you put in.
What this covers
- What IBKR is already good at
- Where the account record stops and analysis begins
- Five questions a statement has no field for
- The tools, and what each one leaves to you
- Getting the data out: the Flex Query route
- The workflow, end to end
- What comes out the other side
- What this does not do
- Quick answers
1. What IBKR is already good at
It is worth being precise about this, because most articles with a title like this one start by pretending the broker is bad at its job. It is not.
The Activity Statement is the single most complete record a retail investor gets anywhere: trades with commissions split out by currency, dividends with the withholding line next to them, corporate actions, interest accruals, cash movements, FX conversions, open positions with cost basis. Flex Queries let you choose the exact fields and schedule the export. PortfolioAnalyst, free with the account, computes time-weighted and money-weighted returns, compares them against a benchmark, charts allocation, and will email you a PDF every month.
If you hold one account, in one currency, and you pay tax in the country whose funds you own, that is genuinely enough. You can stop reading. This article is about the case where it is not: the investor whose residence, broker and fund domicile are three different countries, which is now an ordinary situation and still a badly served one.
2. Where the account record stops and analysis begins
A tracker records what happened in an account. An analyser answers a question about your position — and the difference is not sophistication, it is input data. Every question below needs at least one fact the broker does not hold and never will:
| To answer | You need | Does IBKR have it? |
|---|---|---|
| What a dividend nets you | Fund domicile + your tax residence | Neither. The statement has exchange and currency. |
| Whether a UCITS equivalent pays | Domicile, both expense ratios, your treaty rate | No. It is not a fund database. |
| How much of the balance is yours | Every external deposit, separated from trades | The rows are there; the decomposition is not. |
| Your estate exposure | US-situs share of the account, your residence | No. Situs is a legal attribute, not a ledger field. |
| Your whole portfolio | The other broker too | Not for accounts it does not hold. |
This is why “IBKR portfolio tracker” is the wrong search. Tracking is solved: your broker does it, for free, better than any third party, because it is the source. The unsolved part is the layer above.
3. Five questions a statement has no field for
3.1 “How much of this was me?”
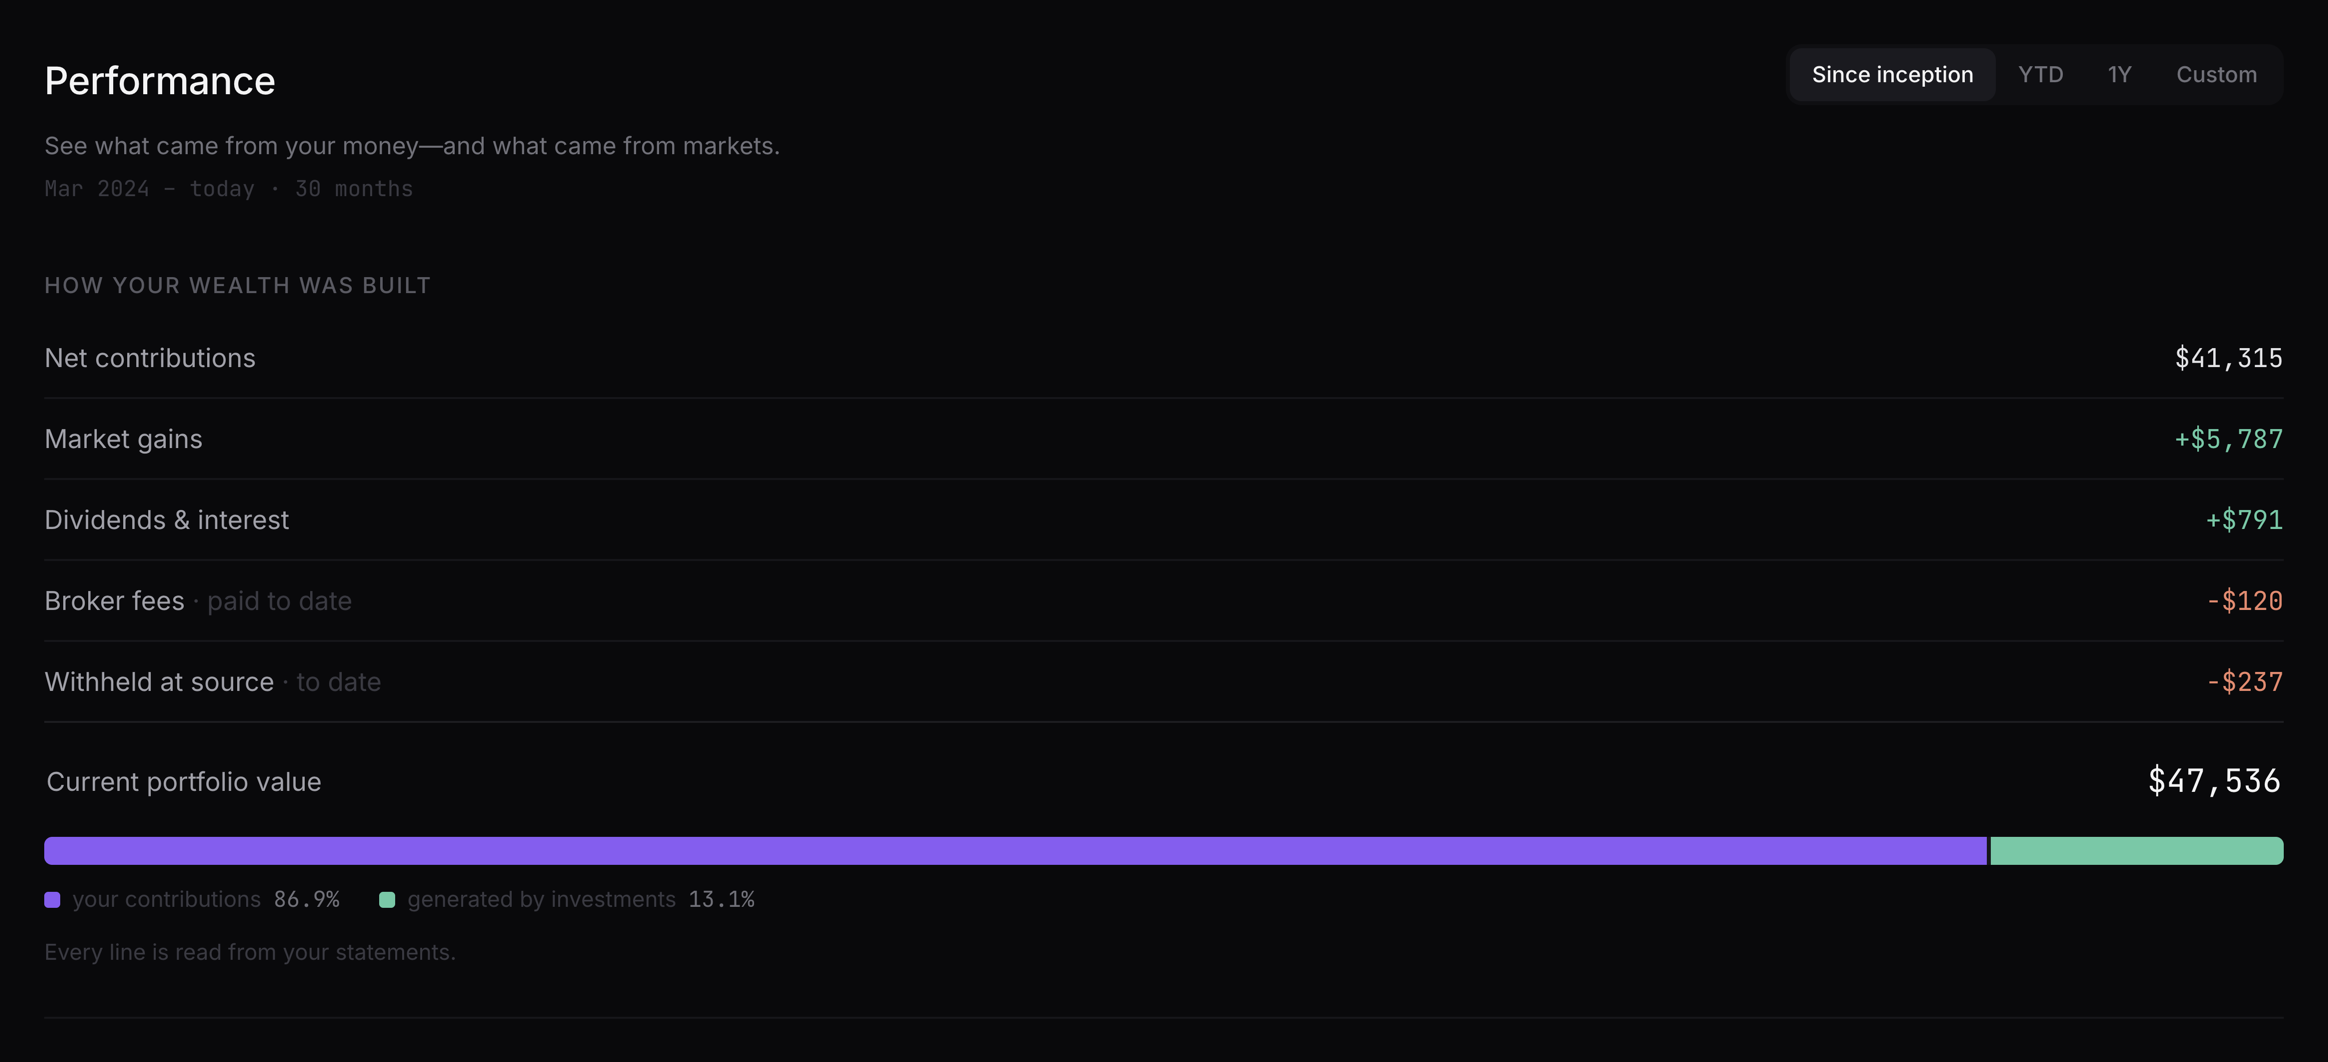
A balance that went from $29,000 to $47,000 over three years tells you nothing until the deposits are taken out of it. PortfolioAnalyst will give you a time-weighted return, which is the correct number for judging the strategy, and a money-weighted return, which is the correct number for judging your experience of it — and those two can sit twenty points apart on the same account in the same year. What neither shows as a running figure is the one investors actually act on: of the balance in front of me, how many dollars did I deposit, and how many did the market add?
That split is arithmetic, not opinion, and it has to close. If contributions plus market movement plus income minus fees and withholding does not equal the balance, the breakdown is wrong and should not be displayed at all. We wrote the long version of this in XIRR, TWR and the metrics that matter, including a worked year that is +35% and −9.7% at the same time depending on which of the two you quote.
3.2 “Where are these funds domiciled?”
Here is the one that catches people. Your statement says CSPX, LSEETF, USD. Three facts, none of them the one that matters: CSPX is Irish. VUSD on Amsterdam in USD is Irish too. VOO is American. The domicile decides the withholding rate on the dividends inside the fund, whether the holding is a US-situs asset for estate purposes, and whether your broker is even allowed to sell it to you.
No broker statement in the world has a domicile column. It is resolved from the ISIN — IE, US, LU — and from the fund’s own documentation, which is why the ISIN is the field that matters most in an export and the ticker matters least.
3.3 “What does this dividend actually net?”
Two taxes, in sequence, and your statement shows the gap between them rather than either one. The first is taken at source before the money reaches your broker — the US rate on a US-domiciled fund’s distribution, your treaty rate if your paperwork is on file, 30% if it is not. The second is taken where you live, when you declare it, at whatever your country charges on foreign dividend income, possibly with credit for the first.
The line in your Activity Statement sits between those two: after the first, before the second. It is neither the gross dividend nor what you keep. Working out the real drag needs the fund’s domicile, the source-country rate, your residence and your treaty position — three of which are not in the file. Our withholding methodology sets out the two-step model and its sources.
3.4 “Is there a UCITS equivalent, and would switching pay?”
This is the question that follows immediately from the previous two, and it is the one that most often gets answered badly — because the saving is obvious and the cost is not. Moving from a US-domiciled fund to its Irish twin can cut the withholding leak, and it usually costs you something in expense ratio, because the UCITS version is rarely cheaper. The only honest figure is the net: withholding saved minus the extra fee, per position, per year.
On some pairs that net is negative. An independent study of our own engine, summarised here, found exactly that on one of two pairs tested — a fund with barely any dividend to protect, carrying a higher TER on the whole position. Counting only the tax saving makes every switch look free. And if the position already exists, the embedded capital gain usually dominates the entire comparison.
3.5 “What is the currency actually doing?”
IBKR reports in your base currency, and a multi-currency portfolio’s return in EUR is a different number from the same portfolio’s return in USD. If your contributions arrived in three currencies over five years, the question “how much did I put in” needs an FX decision for every deposit, applied consistently, or the split in 3.1 quietly stops closing.
4. The tools, and what each one leaves to you
There is no shortage of software that will hold an IBKR portfolio. There is a shortage of software that models domicile against residence. Here is the landscape as it stands, including where we are the wrong answer:
| Tool | Strongest at | Leaves to you |
|---|---|---|
| IBKR PortfolioAnalyst | Reporting on the account that holds the data. TWR and money-weighted returns, benchmark comparison, allocation and dividend summaries, scheduled PDFs. Free, nothing to import. | Everything that depends on who and where you are: domicile, residence, treaty rate, estate situs — and any account IBKR does not hold. |
| A spreadsheet with XIRR | Total control, no subscription, and you will understand every number because you typed it. | Prices, FX, corporate actions, and a withholding table you maintain by hand. It works until the portfolio outgrows your patience. |
| Portfolio Performance (open source, desktop) | Return mathematics done properly — TWR and IRR, local files, no account, no fee. Imports from a long list of brokers. | Desktop-bound and hands-on. Fund domicile against tax residence is not a concept it models. |
| Sharesight | Tax-report depth in the countries it covers, dividend handling, and broker imports including IBKR. If you need a report your accountant recognises, this is the category leader. | It is organised around national tax reporting, not around the structural question of where a fund sits relative to where you do. Priced by portfolio count. |
| Navexa | Australian investors: performance plus CGT reporting against local rules. | Same shape as above, narrower geography. |
| Dividend trackers (Snowball Analytics, Getquin and similar) | Dividend calendars, income forecasts and a social feed. Pleasant to open daily. | Forecasts tend to be gross, or net of a single assumed rate. The two-step cross-border calculation is not what the product is for. |
| BorderFolio | The layer this article is about: contributions separated from market return, domicile resolved per holding, withholding estimated in both steps against your residence, US-situs exposure, and the net of a UCITS switch after the fee. | No live sync, no tax filing output, no real-time prices. If you want a CGT pack for your accountant, buy one of the rows above — several people sensibly run both. |
Checked against each vendor’s public pages in October 2026. Feature sets move and prices change; where a row would decide your choice, verify it with the vendor rather than with us. Our own pricing is on the pricing section, and the side-by-side pages are BorderFolio vs Sharesight and BorderFolio vs Navexa.
5. Getting the data out: the Flex Query route
Two ways in, and for a long history the first is better.
Route A — two Flex Queries (recommended)
A Flex Query is a flat table with fields you pick, which means it lands in the importer as a predictable CSV and is read by a deterministic converter — no language model in the loop, the same file producing the same rows every time. Build two separate queries in Client Portal (Performance & Reports → Flex Queries), not one combined report:
| Query | Fields that must be included | What it becomes |
|---|---|---|
| Trades | Buy/Sell, TradeDate, ISIN, Quantity, TradePrice, TradeMoney, CurrencyPrimary | Your buy and sell history, with cost basis |
| Cash Transactions | Type, SettleDate, ISIN, Description, Amount, CurrencyPrimary | Dividends, interest, and external deposits and withdrawals |
Two optional fields on the Trades query are worth adding: IBCommission and IBCommissionCurrency. The commission is folded into the cost basis when its currency matches the trade’s — IBKR can charge a CHF commission on a USD trade, and adding those francs to a dollar basis would be worse than ignoring them.
Set the format to CSV and the date format to yyyyMMdd, which is the IBKR default. Then a few things that are true of the output and occasionally surprise people:
- There is no symbol column in a Flex trades query, and it does not matter. The ISIN is the key — it carries the domicile, which the ticker does not.
- Rows without an ISIN are currency conversions and are skipped deliberately. An FX trade is not a position; importing it as one would invent a holding you do not have.
- Withholding-tax rows are not counted as income. The sibling row is the dividend itself; counting both would double the distribution.
- Deposits and withdrawals are the point of the second query. Without them, the contribution split in 3.1 has nothing to work with and every return figure degrades to “the balance went up”.
Upload both CSVs together — up to five files per upload, 5 MB each. Re-uploading an overlapping period is safe: the same trade arriving twice is recognised rather than duplicated, so you can widen the date range and import again without cleaning anything up first.
Route B — the Activity Statement
If you would rather not configure anything, export an Activity Statement for the widest period available — PDF, CSV or HTML all work — and upload that instead. It is a multi-section document rather than a table, so it goes through the document parser; the practical difference is that the Flex route is more predictable and the files are smaller. Details on the IBKR statement import page.
Neither route is a connection. A Flex Query is still an export you download. There is no IBKR login, no API key and no Flex Web Service token involved anywhere — nothing in the product can see, let alone touch, your account. The one broker with an optional read-only connection is Freedom24, where you supply your own read-only API keys and can revoke them at the broker; that is described in full on the Freedom24 connection page. For Interactive Brokers, the file is all there is.
6. The workflow, end to end
Export, upload, review — and then the account stops being a ledger. Below is a session on the demo portfolio, which you can open yourself without signing up.

7. What comes out the other side
Performance: the balance, decomposed
Tax: the layer the statement has no column for
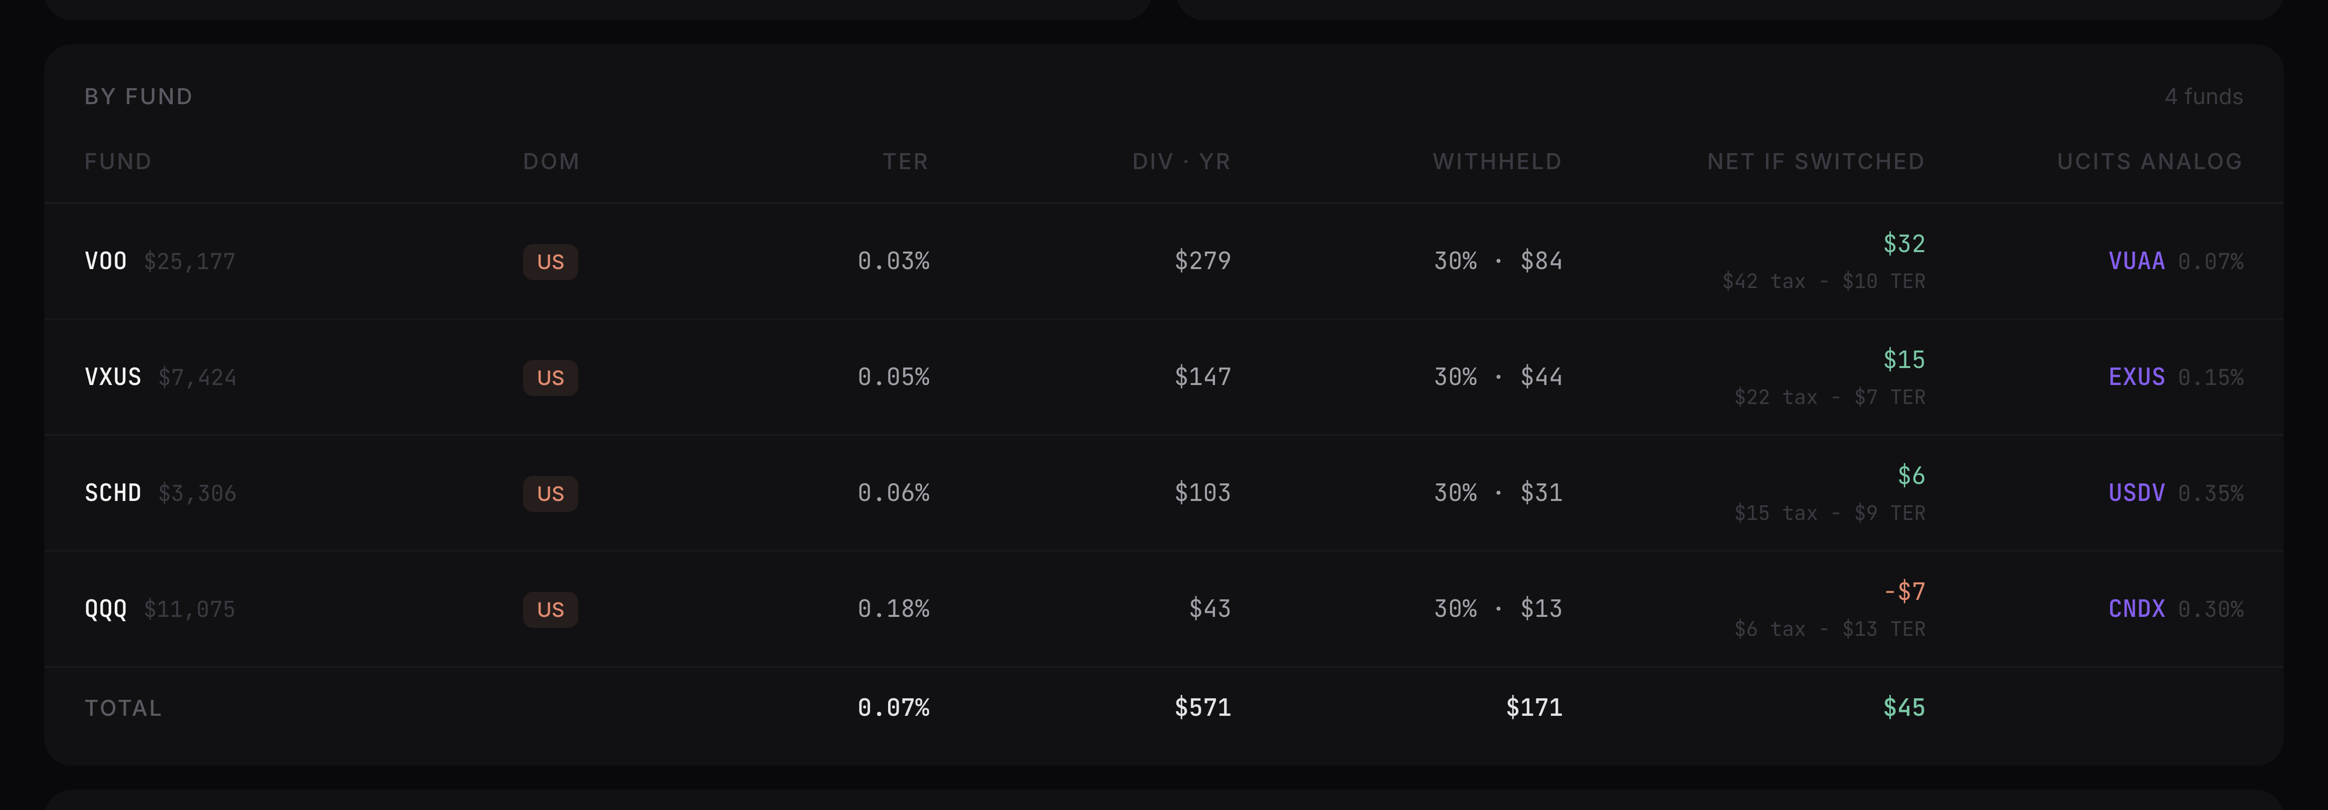
Above that table sit the two aggregates: the dividend tax drag in both steps — withheld at source, then taxed at home — and the structural leak, which is the sum of that last column and therefore cannot disagree with it. When there is nothing to fix, the headline says already efficient rather than inventing a number. Next to them, US estate exposure: how much of the account is a US-situs asset, against the threshold that applies to someone with your residence.
Planner and Independence
The same facts, pointed forward instead of backward. The Planner takes your next contribution, shows the drift between current and target weights, and — the cross-border part — what that particular purchase does to the withholding profile. The Independence page turns the contribution pace into a date: time to target from your measured pace, the coast point, and dividend coverage net of both tax steps rather than gross. The method is in how to track progress to financial independence.
8. What this does not do
- No live sync with IBKR. Positions and history move when you upload; prices refresh on their own schedule from official closing prices, not live ticks. Client Portal is where you watch the market.
- No individual bonds, notes or treasuries. They are priced per 100 of face value and pay coupons rather than dividends; reading them as shares would misstate both the holding and the money put in, so they are named as not imported instead. Bond funds with a ticker import normally.
- No trading, no money movement, no order routing. Nothing here can touch your account, and for IBKR there is no credential that would let it.
- No tax filing figures. Every tax number is an informational estimate on your own holdings with its assumptions shown. Your 1042-S, your local return and your adviser remain the authority.
- Derivatives are not the target. The import is built around positions with an ISIN. If your IBKR account is mostly options and futures, the analysis layer in this article is not measuring what you are doing.
Informational only. This page describes how portfolio data can be analysed and what different tools cover. It is not investment or tax advice, and the figures shown are from a demo portfolio with sample values. Withholding and estate numbers are estimates computed from stated assumptions and from the tax residence you configure; treaty rates depend on paperwork actually on file with your broker. See the investment & tax disclaimer.
9. Quick answers
Can I analyse my IBKR portfolio without connecting my account?
Yes, and with Interactive Brokers there is no other way here: export a Flex Query or an Activity Statement and upload the file. No login, no API key, no Flex token.
Does it read Flex Query exports?
Yes — a Trades query and a Cash Transactions query as two CSVs, parsed by a deterministic converter rather than a model. The field lists are in section 5.
Is this a replacement for PortfolioAnalyst?
No, and it is not trying to be. PortfolioAnalyst reports on the account. This reports on your position across borders, which needs facts the account does not contain.
I hold accounts at IBKR and somewhere else.
That is the usual case, and the reason the import is document-based: statements from several brokers go into one portfolio with one base currency. The mechanics are in combining portfolios from multiple brokers.
What does it cost?
The free tier is one portfolio, ten holdings and three document imports a month — enough to run a Flex Query through it and see your own numbers before deciding. Unlimited holdings and five portfolios are $15/month or $149/year.